|
|
|
Metropolitan Areas: Assessing Competitive Position and Change -- examining the largest & fastest growing metro areas
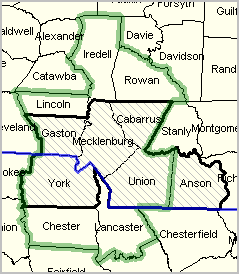
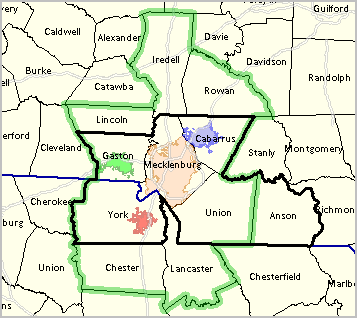
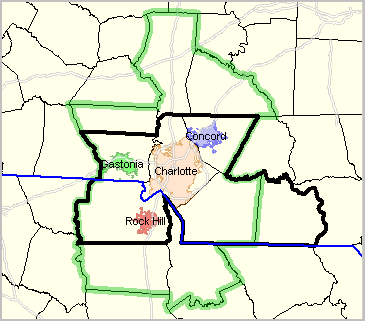
July 2015 -- New 2015 Metropolitan Statistical Area Designation Updates ... one new MSA; sixteen new MISAs, 5 new CSAs ... see http://proximityone.com/metros2015_updates.htm Analyzing Metro Characteristics, Patterns & Trends: Web Session Join us in Data Analytics Lab Session one hour no fee Web session. Accessing, integrating and using multi-sourced data. Changing Metro Structures Reflect Demographic Dynamics The map at right shows different metro vintages for the Charlotte-Concord-Gastonia, NC-SC MSA. Click the link in the table to view a profile for this metro. The profile shows the addition of five counties relative to the Census 2010 vintage. The Census 2010 population of the 2013 vintage metro is 2,217,012 (25th largest) compared to 1,758,038 (33rd largest) based on the 2010 vintage of the metro. The Charlotte metro ranks 24th in population (2,296,569) among 2013 vintage metros based on the 2012 estimate. Several metros have 2012 population of similar size including: San Juan-Carolina-Caguas, PR, Portland-Vancouver-Hillsboro, OR-WA, San Antonio-New Braunfels, TX, Orlando-Kissimmee-Sanford, FL, Sacramento--Roseville--Arden-Arcade, CA with others quite close. See in interactive ranking table. See Census 2000 and Census 2010 population for Census 2010 vintage metros at http://proximityone.com/metros0010.htm Selected Metro Updates & Related Resources -- scroll section
Demographic-Economic Interactive Tables -- frequently updated
01.05.16. Characteristics of Largest 50 Metropolitan Areas ... narrative, GIS project & datasets ... see http://proximityone.com/largest_50_metros.htm Largest 50 Metros based on population rank  12.23.15. Metro New Residential Construction ... monthly updates; interactive table & GIS project/datasets ... downloadable GIS resources ... view these updates integrated into individual metro reports ... see http://proximityone.com/metro_residentialconstruction.htm Patterns of New Authorized Residential Units by Metro 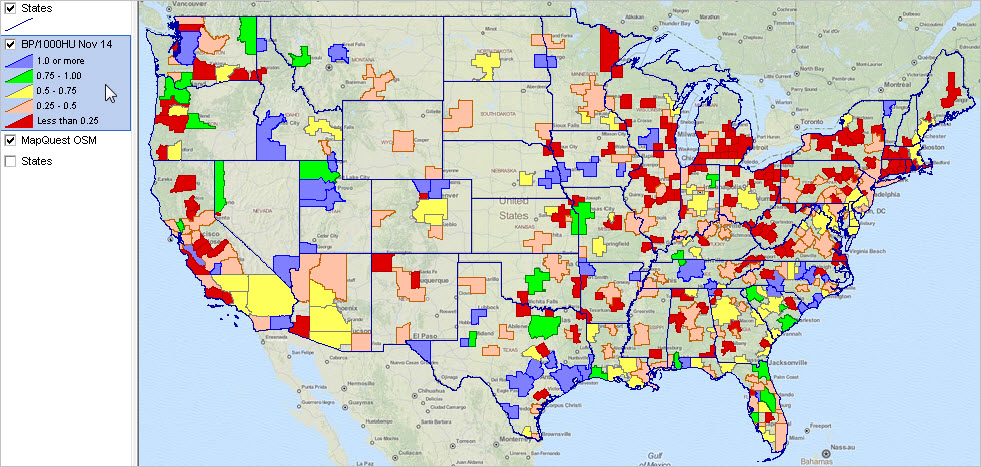 12.21.15. Metropolitan Area Gross Domestic Product ... time series; examining patterns; analytical tools ... interactive table; downloadable GIS resources ... view these data integrated into individual metro reports ... see http://proximityone.com/metrogdp.htm Percent Change in Real GDP by Metro, 2009-2014 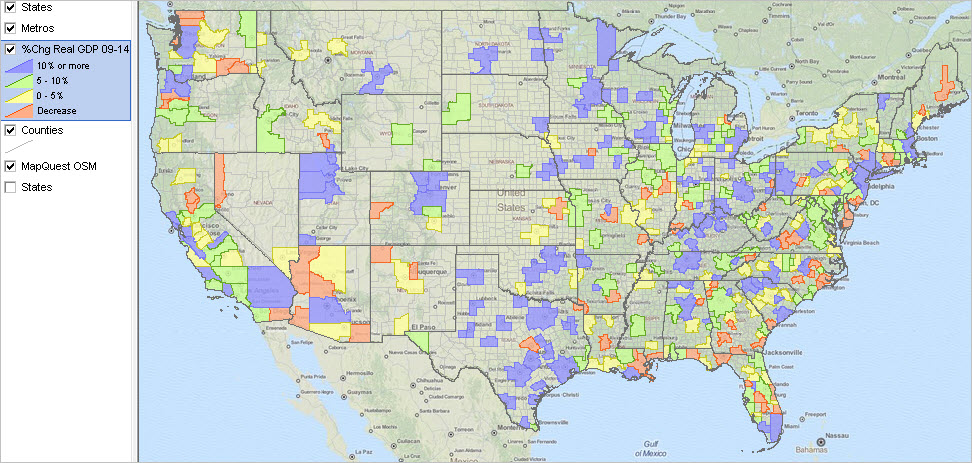 12.18.15. Establishments, Employment & Wages 2015Q2 Update ... quarterly establishment, employment & wage data by sector ... U.S., state, metro, county; interactive table; downloadable GIS resources ... view these updates integrated into individual metro reports ... see http://proximityone.com/eee.htm Where America makes things ... 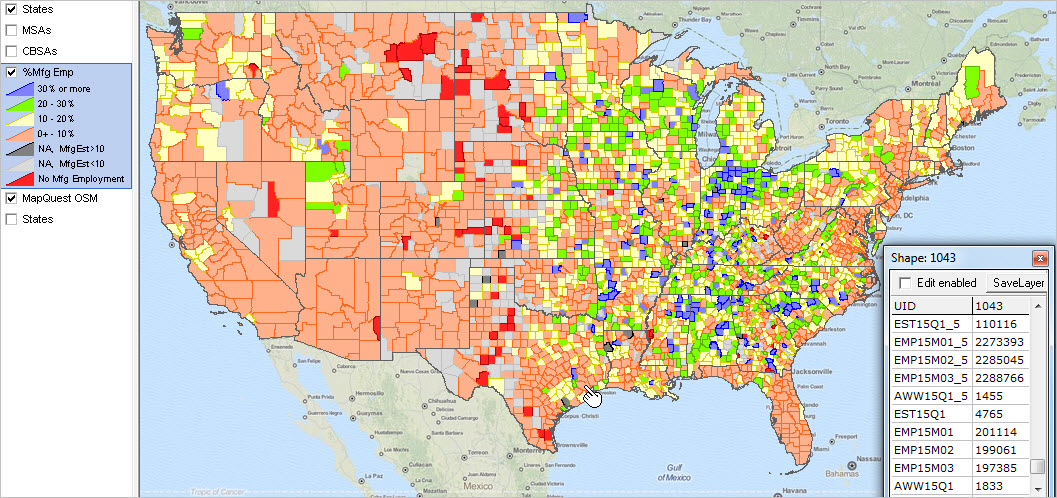 12.14.15. Statistical Release Dates for 2016 ... table showing statistical release dates for 2016 ... builds on OMB Principal Federal Economic Indicators list/calendar ... see http://proximityone.com/staying_ahead.htm#calendar 12.11.15. Analyzing the Local Area Employment Situation ... monthly updates on the employment-unemployment characteristics ... updated through October 2015; interactive table; downloadable GIS resources ... view these updates integrated into individual metro reports ... see http://proximityone.com/laes.htm Unemployment Rate by Metro 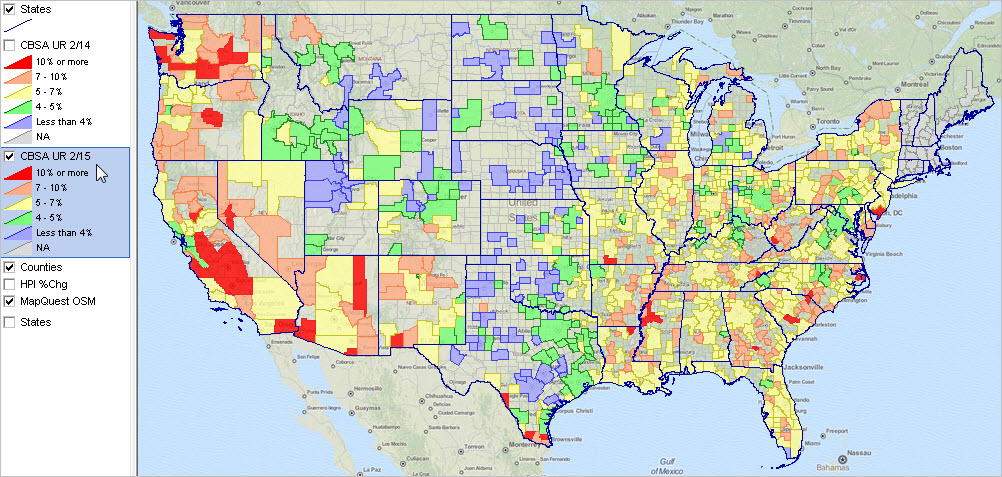 12.07.15. Metropolitan Areas & Fortune 1000 Companies ... counts and lists of Fortune 1000 companies by metro ... See http://proximityone.com/metros_fortune1000.htm Fortune 1000 companies in context of metros 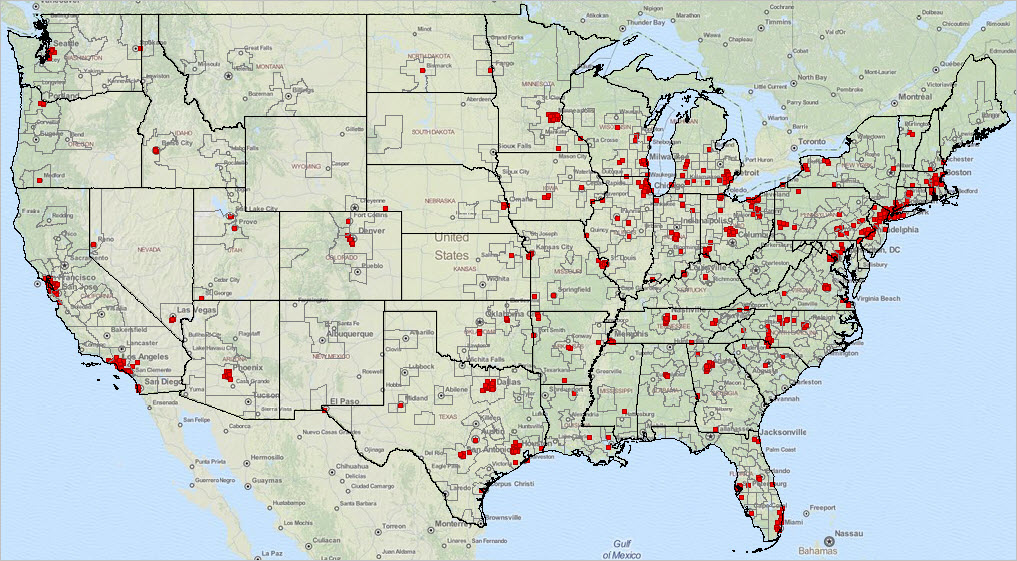 12.04.15. Metropolitan Area Situation & Outlook Reports ... updated with new content and expanded structure ... access a report for any metro ... See http://proximityone.com/metro_reports.htm 11.25.15. Housing Units Patterns & Trends: County, Metro, State ... interactive table & GIS tools/applications ... See http://proximityone.com/housing_units.htm Housing Unit Percent Change by County: 2010-2014 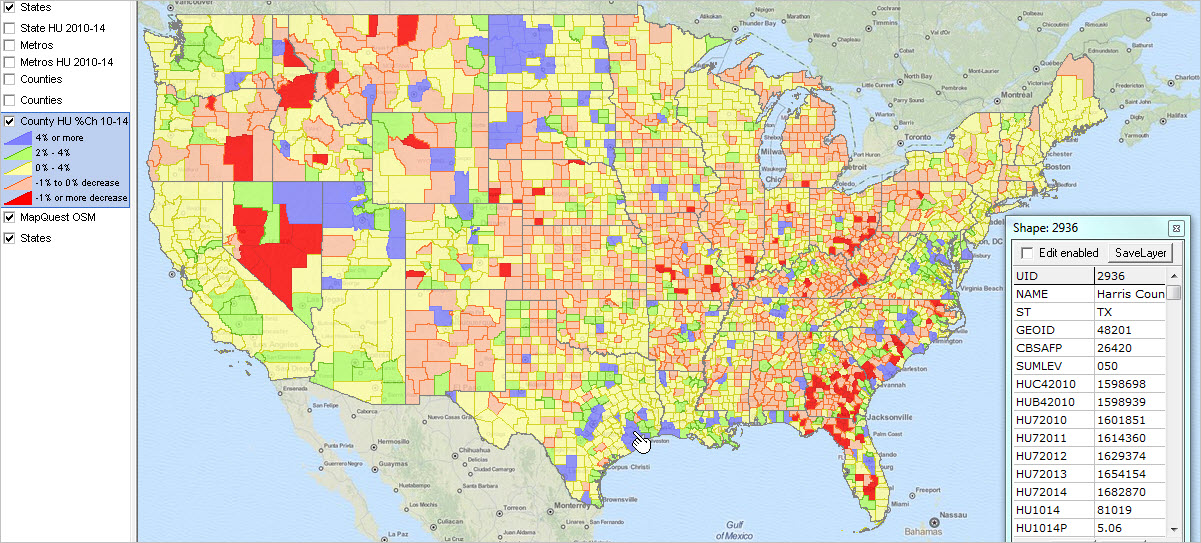 11.23.15. Rental Market Conditions by State & Metro ... interactive table & GIS tools/applications ... See http://proximityone.com/metro_rentalmarket.htm Atlanta/Southeastern U.S. rental vacancy rate by metro  11.20.15. Regional Economic Information System: 2015 Annual Update ... interactive table & GIS tools/applications ... personal income by major source & employment and earnings by industry ... See http://proximityone.com/reis.htm San Francisco Metro/Area 2014 Per Capita Personal Income by County 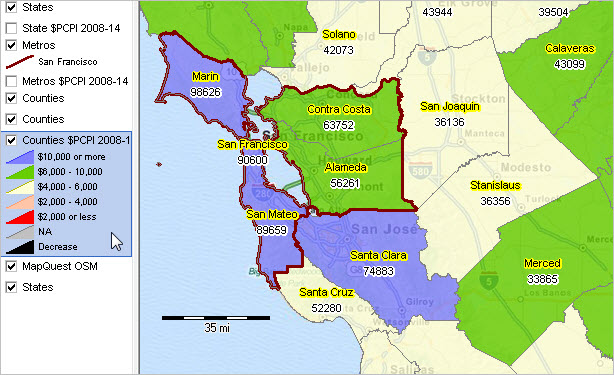 11.16.15. U.S.-State-Metro Demographic-Economic Interactive Analysis ... examining patterns & characteristics of individual/all metros ... 2014 attributes of states & current vintage metros General Demographics | Social Characteristics | Economic Characteristics | Housing Characteristics 11.10.15. Employment-Employment-Earnings by industrial sector ... new 2015Q1 county, metro, state interactive table ... Manhattan tops financial sector average weekly wages at $8,932 ... examine your industry and geography of interest ... http://proximityone.com/eee.htm Metro Housing Value & Household Income: 2013-2014 • patterns of change; interactive table; examine peer group • using the ACS 2013 and ACS 2014 (new 9/17/15) estimates • http://proximityone.com/metros_2013_2014.htm Metro Profiles • example ... Atlanta metro • click link in column 2 in interactive table below to view a metro of interest. 2014 Demographic Updates for 2013 Vintage Metros New June 2015 ... • View, rank, compare metros contextually with counties and states. • Interactive table & details: http://proximityone.com/countytrends.htm 2013 Demographic-Economic Data for 2013 Vintage Metros New October 2014 ... • For first time ... 2013 ACS demographic-economic data for current vintage CBSAs • Interactive table & details: http://proximityone.com/acs2013_metros.htm Households by Computer Use & Internet Access -- by Metro September 2014 ... • Among the largest metros in 2013, metro total households having broadband Internet access ranged from 29.5% (Gallup, NM MISA) to 86.0% (San Jose-Sunnyvale-Santa Clara, CA MSA). • Interactive table & details: http://proximityone.com/computer_use.htm 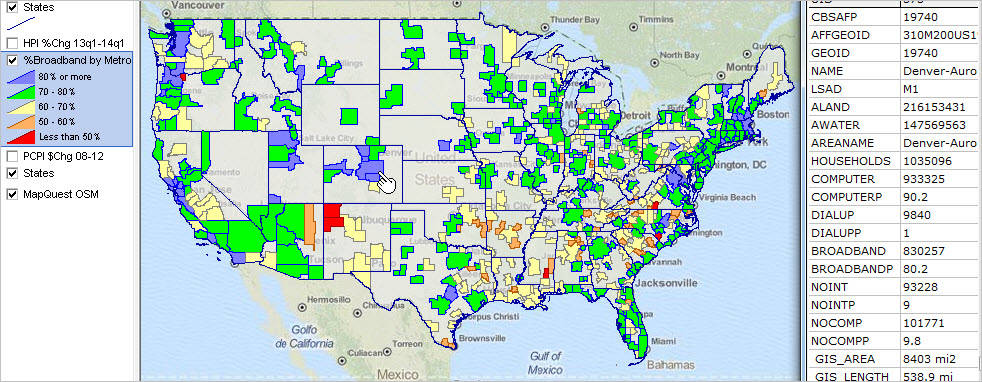 Making Custom Metropolitan Area Maps New July 2014 -- use these no fee GIS resources; make custom metro area maps - one/any metro, all metros; create views adding your own data; link with other geography 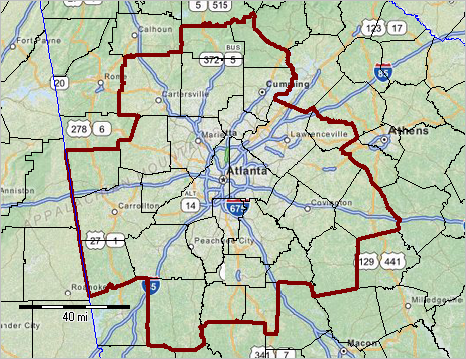 Metro by County Demographic Composition Profiles Extended New June 2014 -- annual population estimates 2010-2013 and change - click link for metro of interest in interactive table below National/State/Metro Quarterly Housing Price Index Updates New June 2014 -- data for 2014Q1 and quarterly trends - interactive ranking table -- http://proximityone.com/hpi.htm  Rental Market Conditions by State & Metropolitan Area; 2014 Update New May 2014 -- http://proximityone.com/metro_rentalmarket_2014.htm - U.S., states and metros -- interactive housing market characteristics table  Metro & State Real Per Capita Personal Income; 2008-12 New April 2014 -- http://proximityone.com/metro_rppi.htm - interactive table -- view/query/rank/compare - ready-to-use GIS resources -- click graphic for larger view & details 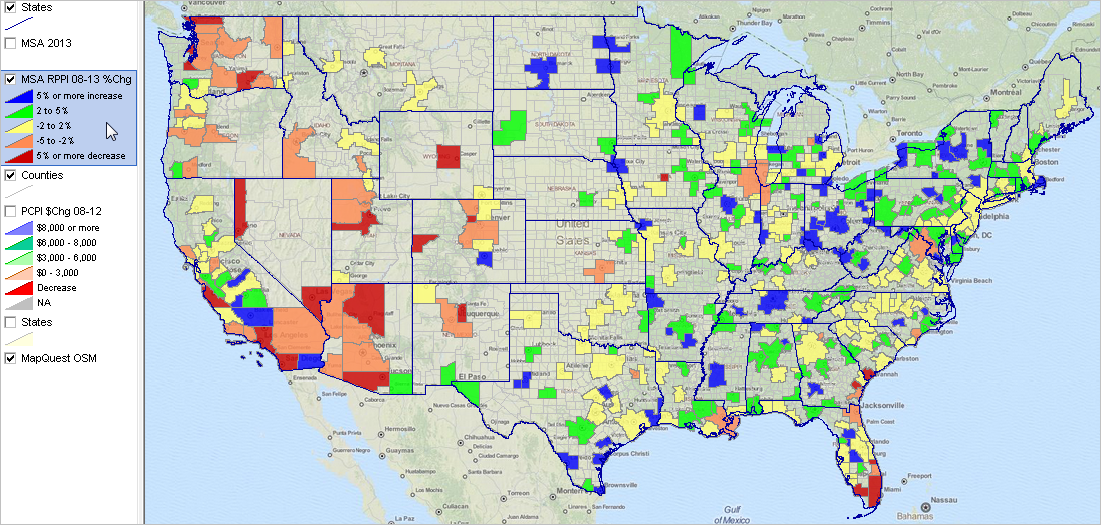 New Metro & County Population Estimates & Components of Change New March 2014 -- Metro & County Demographic Trends - latest official estimates; annual data 2010 forward - interactive table -- view/query/rank/compare - ready-to-use GIS resources -- click graphic for larger view & details 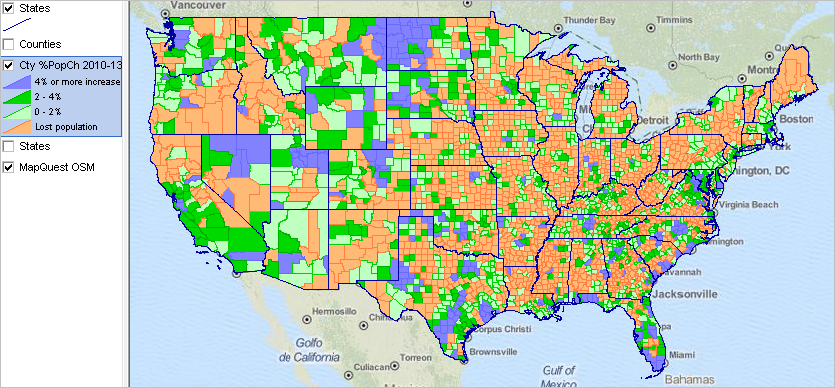 Principal Cities of Metropolitan Areas New February 2014 -- based on ACS 2012 5-year estimates; estimates centric to 2010 - Principal Cities Interactive city/place demographic-economic tables; include all cities/places ... principal city records/rows include CBSA/metro code - General Demographics - Social Characteristics - Economic Characteristics - Housing Characteristics State-Metro-County Demographic-Economic Interactive Tables New February 2014 -- based on ACS 2012 5-year estimates; estimates centric to 2010 -- includes all counties (metro & non-metro); examine any metro and its component counties - General Demographics - Social Characteristics - Economic Characteristics - Housing Characteristics State & Metro Demographic-Economic Interactive Tables New January 2014 -- based on ACS 2012 1-year estimates; estimates centric to 2012 -- most recent metro estimates (will update Sept. 2014); do not include county breakouts - General Demographics - Social Characteristics - Economic Characteristics - Housing Characteristics Regional Economic Information System Updates, new November 2013. Use the interactive table (http://proximityone.com/reis13.htm) to find out personal income and personal income components in counties and metros of interest compare to one another -- based on 2013 vintage metros. Click links below to view sample REIS profile spreadsheets for Harris County, TX and the Houston MSA for 2011 and 2012. • Personal income, per capita personal income, and population -- CA1-3 • Personal income summary -- CA04 • Personal income and earnings by industry -- CA05N • Compensation of employees by industry -- CA06N • Economic profiles -- CA30 • Gross flow of earnings -- CA91 See more about these data contextually with other demographic-economic measures Houston Metro. Metro GDP Updates, new September 2013. Use the interactive table (http://proximityone.com/metrogdp.htm) to find out how metros of interest compare to one another and how current-dollar and real GDP have changed over the period 2009 to 2012 -- based on 2013 vintage metros. ACS 2012 Demographic-Economic Updates, new September 2013. Use the interactive table (http://proximityone.com/metro_acs12.htm) to examine demographic-economic patterns based on the latest American Community Survey (ACS) 2012 1-year estimates (these data based on 2009/10 vintage metros). Create custom 2013 metro map views. Examine your geography/patterns of interest in context of one or all metros. No fee, no registration. See examples; get started. Examining Long-term Change. The U.S. population ages 65 and over is expected to more than double between now and 2060, from 43.5 million to 92.0 million (interactive table). How will this population, and other age groups, be distributed by state and metro? Find out more about this topic and related demographic-economic trends. Join us in a one-hour Web session -- register here. ProximityOne Metro Current Estimates & Projections; Related Resources • new 2013 metro shapefiles for mapping and geospatial applications • ProximityOne estimates & projections; Outlook 2020 | Outlook 2030 | Outlook 2060 | Quarterly 3 year • integrated multi-sourced Situation & Outlook demographic-economic data • extended ranking and equivalence tables making use of the 2013 metros Use the interactive table shown below to examine attributes of the 2013 vintage metropolitan areas. Click a link in the table below to view county components and more details about a metro. 2013 Vintage (Current) Metropolitan Areas; Population: Census 2010 & Post-Census Estimates Table initially sorted descending based on 2013 population estimate. Click link in column 2 (Code) to view Metro Profile for selected metro (updates frequently). Click column header to sort; again to sort other direction. Usage notes below table. See related Ranking Tables Main Page Usage Notes • Click ShowAll between queries/filters. • Use left-most column to select by primary state of metro. • Select Type = MISA for Micropolitan Statistical Area. • Select Type = MSA for Metropolitan Statistical Area. Column Headers • State -- USPS state abbreviation; first state that appears CBSA (Core-Based Statistical Area) name all rows and data in table are for total CBSA whether in multiple states or only one • Pop2010 -- Census 2010 (4/1/2010) with counties defined as of 2013 vintage metros Census Bureau estimates released 3/14: • Pop 7/10 -- Population estimate (7/1/2010); counties defined as of 2013 vintage CBSAs • Pop 7/11 -- Population estimate (7/1/2011); counties defined as of 2013 vintage CBSAs • Pop 7/12 -- Population estimate (7/1/2012); counties defined as of 2013 vintage CBSAs • Pop 7/12 -- Population estimate (7/1/2012); counties defined as of 2013 vintage CBSAs • Chg10-13 -- population change Pop 7/10 to Pop 7/13 • %Chg10-13 -- percent population change from Pop 7/10 to Pop 7/13 Selected Views -- Charlotte-Concord-Gastonia, NC-SC MSA with Principal Cities
Selected Views -- Columbus, OH MSA 2013 green boundary cross-hatch pattern; 2010 black boundary/diagonal-hatch pattern Perry & Hocking counties added under 2013 classification; previously not metro counties. 
Selected Views -- Kansas City MO-KS MSA 2013 green boundary cross-hatch pattern; 2010 black boundary/diagonal-hatch pattern Franklin County, KS removed under 2013 classification; Franklin County, KS becomes Ottawa, KS MISA. 
Selected Views -- Knoxville, TN MSA 2013 green boundary cross-hatch pattern; 2010 black boundary/diagonal-hatch pattern • Campbell County added under 2013 classification; was La Follette, TN MISA under 2010 classification. • Roane County added under 2013 classification; was Harriman, TN MISA under 2010 classification. • Grainger County added under 2013 classification; was part of Morristown, TN MSA under 2010 classification. • Morgan County added under 2013 classification; previously not a metro county. 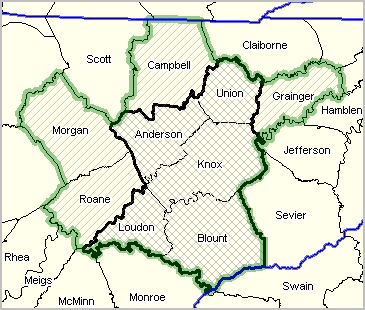
Selected Views -- Lafayette, LA MSA 2013 green boundary cross-hatch pattern; 2010 black boundary/diagonal-hatch pattern Acadia, Iberia, Vermilion counties added under 2013 classification. 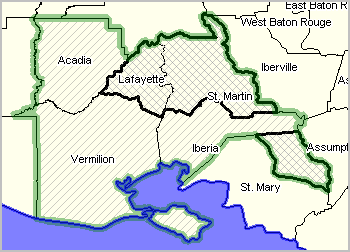
Selected Views -- Minneapolis-St. Paul-Bloomington, MN-WI MSA 2013 green boundary cross-hatch pattern; 2010 black boundary/diagonal-hatch pattern Le Sueur MN, Mille Lacs MN, Sibley MN counties added under 2013 classification. 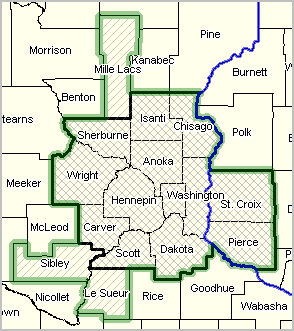
Selected Views -- Richmond, VA MSA 2013 green boundary cross-hatch pattern; 2010 black boundary/diagonal-hatch pattern Cumberland, Louisa, King and Queen counties removed under 2013 classification. 
Selected Views -- Washington-Arlington-Alexandria, DC-VA-MD-WV MSA 2013 green boundary cross-hatch pattern; 2010 black boundary/diagonal-hatch pattern Culpeper and Rappahannock counties added under 2013 classification; Culpeper County MISA status removed. 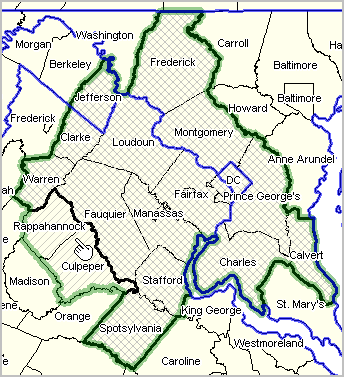
About Current Vintage Metros The current vintage metropolitan areas used for data tabulation (February 28, 2013) include approximately 94 percent of the U.S. population -- 85 percent in metropolitan statistical areas (MSAs) and 9 percent in micropolitan statistical areas (MISAs). Of 3,143 counties in the United States, 1,167 are in the 381 MSAs in the U.S. and 641 counties are in the 536 MISAs (1,335 counties are in non-metro areas). By definition, metropolitan areas are comprised of one or more contiguous counties. Metropolitan areas are not single cities and typically include many cities. Metropolitan areas are comprised of urban and rural areas and often have large expanses of rural territory. A business and demographic-economic synergy exists within each metro; metros often interact with adjacent metros. The demographic-economic makeup of metros vary widely and change often. The U.S. Office of Management & Budget (OMB) announced revised delineations of Metropolitan Statistical Areas (MSAs), Micropolitan Statistical Areas (MISAs) and Combined Statistical Areas (CSAs) effective 2/28/13. The delineations reflect the Standards for Delineating Metropolitan and Micropolitan Statistical Areas as published on June 28,2010, Federal Register (75 FR 37246 -37252) and the application of those standards to Census Bureau population and journey-to-work data. All Federal agencies producing statistical data for metros are to use these designations. An update to the 2013 vintages metros was announced in 2015 (see above). This change affects very few small metros and will have no impact on summary data by metro until later in 2016 or 2017. Selected Highlights • There are several new MSAs and some have been declassified from the list. • From metro to metro, some counties have been added while others have been removed. • 929 metros (MSAs and MISAs) now exist in the U.S. and Puerto Rico. • The 929 metros are also referred to as Core-Based Statistical Areas (CBSAs). • 388 MSAs now exist (381 in the U.S. and 7 in Puerto Rico) • 11 MSAs contain a total of 31 Metropolitan Divisions (MDs) • 541 MISAs now exist (536 in the U.S. and 5 in Puerto Rico) • 169 CSAs now exist with their 524 component MSAs and/or MISAs • 38 New England City and Town Areas (NECTAs) now exist • 6 Combined NECTAs now exist with their 26 component NECTAs Metropolitan Statistical Areas (MSAs) have at least one urbanized area of 50,000 or more population, plus adjacent territory that has a high degree of social and economic integration with the core as measured by commuting ties. Micropolitan Statistical Areas (MISAs) have at least one urban cluster of at least 10,000 but less than 50,000 population, plus adjacent territory that has a high degree of social and economic integration with the core as measured by commuting ties. MSAs and MISAs are delineated in terms of whole counties (or equivalent entities), including in the six New England States. If specified criteria are met, a MSA containing a single core with a population of 2.5 million or more may be subdivided to form smaller groupings of counties referred to as Metropolitan Divisions. If specified criteria are met, adjacent Metropolitan and Micropolitan Statistical Areas, in various combinations, may become the components of a set of complementary areas called Combined Statistical Areas. For example, a Combined Statistical Area may comprise two or more MSAs, a MSA and a MISA, two or more MISAs, or multiple MSAs and MISAs that have social and economic ties as measured by commuting, but at lower levels than are found among counties within MSAs and MISAs. Support Using these Resources Learn more about demographic economic data and related analytical tools. Join us in a Data Analytics Lab session. There is no fee for these one-hour Web sessions. Each informal session is focused on a specific topic. The open structure also provides for Q&A and discussion of application issues of interest to participants. ProximityOne User Group Join the ProximityOne User Group to keep up-to-date with new developments relating to geographic-demographic-economic decision-making information resources. Receive updates and access to tools and resources available only to members. Use this form to join the User Group. Additional Information ProximityOne develops geographic-demographic-economic data and analytical tools and helps organizations knit together and use diverse data in a decision-making and analytical framework. We develop custom demographic/economic estimates and projections, develop geographic and geocoded address files, and assist with impact and geospatial analyses. Wide-ranging organizations use our tools (software, data, methodologies) to analyze their own data integrated with other data. Follow ProximityOne on Twitter at www.twitter.com/proximityone. Contact ProximityOne (888-364-7656) with questions about data covered in this section or to discuss custom estimates, projections or analyses for your areas of interest. |
|
|