
|
|
|
Metro & County Demographics Trends -- examining the largest & fastest growing metros & counties since 2010
Visual Analysis using GIS Resources Examine patterns and trends using Geographic Information System (GIS) resources. Download the project with ready-to-use analytical views; add your data and modify views to meet specific subject matter and geographic interests. Available to members of the ProximityOne User Group. Join now, there is no fee. Population Percent Change by County, 2010-2013 CTYPOP2013 GIS project start-up view. 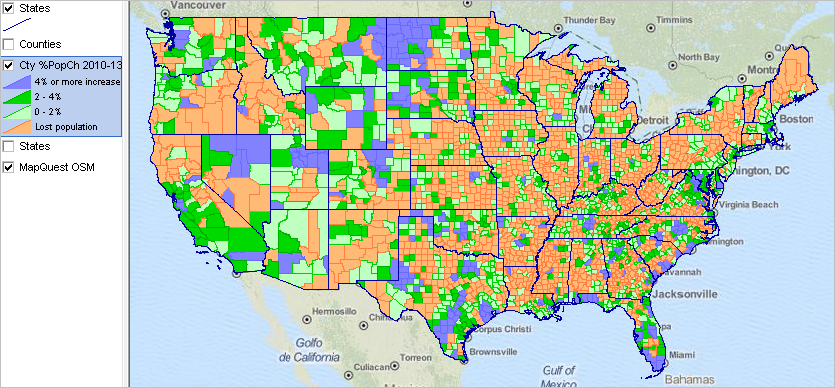 Click graphic for larger view and details. Net Migration by County, 2013 CTYPOP2013TX GIS project start-up view; illustrates visual analysis of net migration by county for 2013 (mid-2012-mid-2013); uses same project files as CTYPOP2013; only query and zoom settings differ. 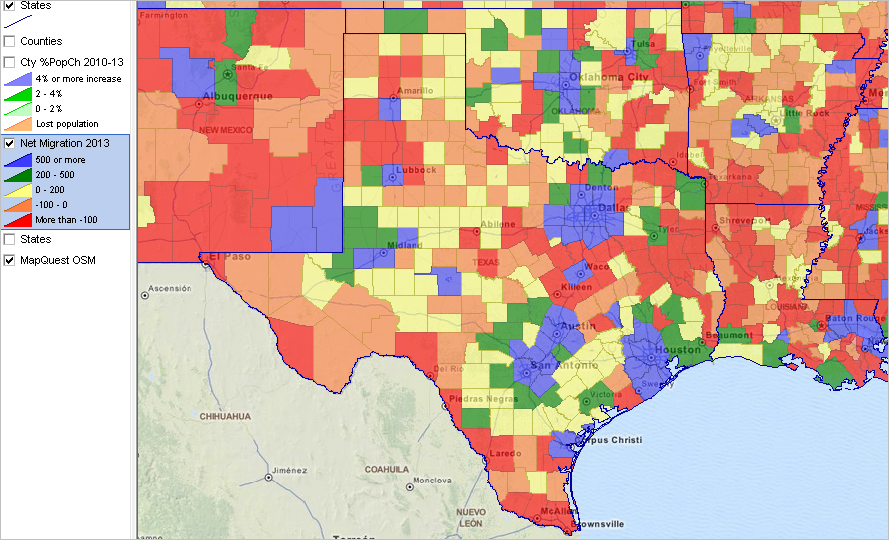 Click graphic for larger view and details. Interactive Table Use the interactive table shown below to examine counties, metros and metros by county. Examine annual change in population by component of population change (births, deaths, domestic migration and international migration). The next two graphics are screenshots of the table. Develop your own similar rankings for states of interest (use filter selection below table). Top 10 Metros Ranked on Population Growth 2012-2013 Ranked in descending order on far right column in graphic. 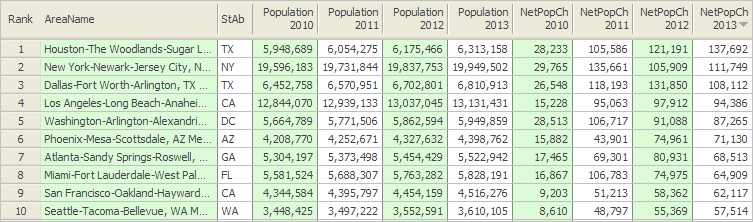 Click graphic for larger view and details. Top 10 Counties Ranked on Population Growth 2012-2013 Ranked in descending order on far right column in graphic. 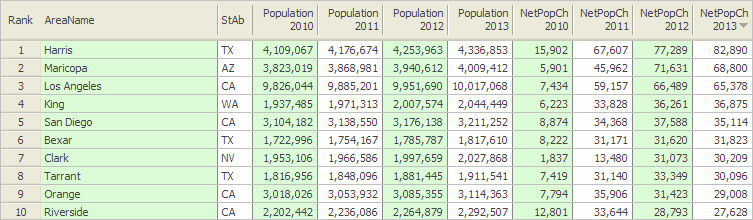 Click graphic for larger view and details. Metro & County Population & Components of Change: 2010-2013 Table initially sorted county within state followed by metros. Click column header to sort; again to sort other direction. Usage notes below table. See related Ranking Tables Main Page Usage Notes • Click ShowAll between queries/filters. • Find in Name: - key in text to right to button to find in Col 1 (case sensitive) - if text is "Metro" (no quotes), all Metropolitan Statistical Areas (MSAs) will be selected - if text is "Micro" (no quotes), all Micropolitan Statistical Areas (MISAs) will be selected - if text is "Houston" (no quotes), all areas with "Houston" in name will be selected Column Headers
• AreaName
• StAb • Sum Lev • St • Cty • CBSA • MD • CSA • Population Cen 2010 • Hsg Units Cen 2010 • Population 2010 • Population 2011 • Population 2012 • Population 2013 • NetPopChg 2010 • NetPopChg 2011 • NetPopChg 2012 • NetPopChg 2013 • Births 2010 • Births 2011 • Births 2012 • Births 2013 • Deaths 2010 • Deaths 2011 • Deaths 2012 • Deaths 2013 • Nat Increase 2010 • Nat Increase 2011 • Nat Increase 2012 • Nat Increase 2013 • Intl Migr 2010 • Intl Migr 2011 • Intl Migr 2012 • Intl Migr 2013 • Dom Migr 2010 • Dom Migr 2011 • Dom Migr 2012 • Dom Migr 2013 • Net Migr 2010 • Net Migr 2011 • Net Migr 2012 • Net Migr 2013 • Grp Qtrs Base • Grp Qtrs 2010 • Grp Qtrs 2011 • Grp Qtrs 2012 • Grp Qtrs 2013 • Birth Rate 2011 • Birth Rate 2012 • Birth Rate 2013 • Death Rate 2011 • Death Rate 2012 • Death Rate 2013 • NatIncr Rate 2011 • NatIncr Rate 2012 • NatIncr Rate 2013 • Intl Migr Rate 2011 • Intl Migr Rate 2012 • Intl Migr Rate 2013 • Dom Migr Rate 2011 • Dom Migr Rate 2012 • Dom Migr Rate 2013 • Net Migr Rate 2011 • Net Migr Rate 2012 • Net Migr Rate 2013 Support & DMI Web Sessions Learn more about using resources described in this section. Join us in a Decision-Making Information Web session. There is no fee for these one-hour Web sessions. Each informal session is focused on a specific topic. The open structure also provides for Q&A and discussion of application issues of interest to participants. We can address your specific questions about using metro and county demographic economic data and related applications. Additional Information ProximityOne develops geographic-demographic-economic data and analytical tools and helps organizations knit together and use diverse data in a decision-making and analytical framework. We develop custom demographic/economic estimates and projections, develop geographic and geocoded address files, and assist with impact and geospatial analyses. Wide-ranging organizations use our tools (software, data, methodologies) to analyze their own data integrated with other data. Follow ProximityOne on Twitter at www.twitter.com/proximityone. Contact ProximityOne (888-364-7656) with questions about data covered in this section or to discuss custom estimates, projections or analyses for your areas of interest. |
|
|