
|
|
|
Real Per Capita Personal Income by State & Metro: 2008-2012
Implications of Changing RPPI (scroll section)
Some caution is important in interpreting change in real per capita personal income (RPPI).
Personal income is the income received by all persons from all sources. Personal income is the sum of net earnings by place of residence, property income, and personal current transfer receipts.
Real, price-adjusted, estimates of per capita personal income (RPPI) is one of the best measures of overall economic prosperity.
But it is only one measure and omits other aspects of quality of life and related measures.
If the population of the area is falling, the RPPI will be increasing even though there is no increase in total real personal income. Similarly, high population growth areas may reflect a subdued RPPI growth. Government transfer payments, such as unemployment benefits and government assistance, can be increase or decrease personal income and mask the real performance of the area economy. Some areas were already experiencing depressed conditions in 2008, while others had been accelerating rapidly. There relative differences may not be fully reflected by the RPPI alone. Pattern Analysis using GIS Resources Examine patterns and trends using Geographic Information System (GIS) resources. Download the project with ready-to-use analytical views; add your data and modify views to meet specific subject matter and geographic interests. Available to members of the ProximityOne User Group. Join now, there is no fee. • Expand metro_rppi1.zip to the folder c:\reis13 • With CV XE GIS running, use File>Open to open the GIS project c:\reis13\metro_rppi1.gis. Real Per Capita Personal Income by Metro; Percent Change 2008-12 The following view, developed with CV XE GIS using related RPPI GIS project, shows the percent change in real per capita personal income, 2008-12, by metro. 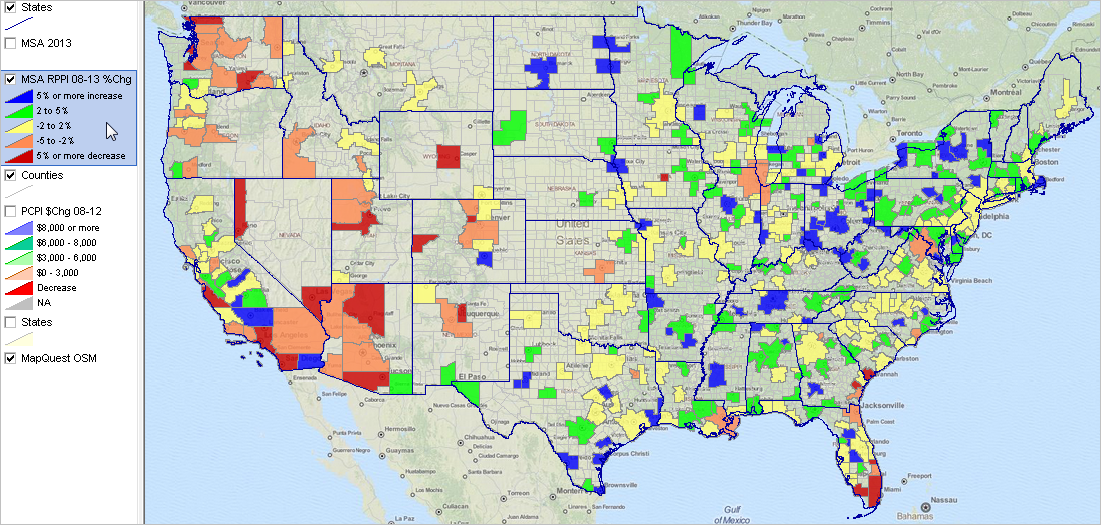 Click graphic for larger view and details. See zoom-in view of Texas/South Central metros below in this section. Real Per Capita Personal Income by State & Metro: 2008-2012 Interactive Table Table initially sorted by state then metro. Click column header to sort; again to sort other direction. Usage notes below table. See related Ranking Tables Main Page Usage Notes • Click ShowAll between queries/filters. • Find text in AreaName: key in text to right of Name> button (case sensitive) then click Name> button • -1 indicates the value in this cell is not available. South Central & Texas Metros The following view is similar to the U.S. by metro view above, showing patterns of real per capita personal income (RPPI) by metro, percent change 2008-12, with metros labeled with 2012 RPPI.  Support & DMI Web Sessions Learn more about using resources described in this section. Join us in a Decision-Making Information Web session. There is no fee for these one-hour Web sessions. Each informal session is focused on a specific topic. The open structure also provides for Q&A and discussion of application issues of interest to participants. We can address your specific questions about using metro and county demographic economic data and related applications. Additional Information ProximityOne develops geographic-demographic-economic data and analytical tools and helps organizations knit together and use diverse data in a decision-making and analytical framework. We develop custom demographic/economic estimates and projections, develop geographic and geocoded address files, and assist with impact and geospatial analyses. Wide-ranging organizations use our tools (software, data, methodologies) to analyze their own data integrated with other data. Follow ProximityOne on Twitter at www.twitter.com/proximityone. Contact ProximityOne (888-364-7656) with questions about data covered in this section or to discuss custom estimates, projections or analyses for your areas of interest. |
|
|