
|
|
|
City-Place Demographic-Economic Interactive Tables -- ACS 2012 Economic Characteristics
New February 2014. The U.S. national scope ACS 2012 City-Place Demographic-Economic Dataset contains approximately 600 subject matter items tabulated for each city-place organized into four subject matter groups: • General Demographics • Social Characteristics • Economic Characteristics -- this section • Housing Characteristics These data are based on the American Community Survey (ACS) 2012 5-year estimates. City/places are defined as the latest 2013 vintage. See notes on importance of these data. See similar ranking tables for: ... U.S.-State-Metro-County | Census Tracts | ZIP Codes | School Districts. Use the interactive ranking table in this section to view, query, rank, compare economic characteristics for these areas. The scroll box shown below lists each of the subject matter items available for each area via the ranking table. In the subject matter items scroll box, subject matter items are organized into to mini-tables with related items. The number at the left of the subject matter item is also used as the short name for the subject matter item in the column header in the ranking table. Visual Analysis of Metro-Place Patterns This view shows median household income by city/place and metro focused on the Phoenix, AZ area. The thematic pattern shows item E062 shown in the DP3 interactive table -- below. Click graphic for larger view and details. Patterns shown for metros (cross-hatched pattern) and places (solid pattern) in same view. View related Phoenix area cities zoom-in (places labeled with median household income). 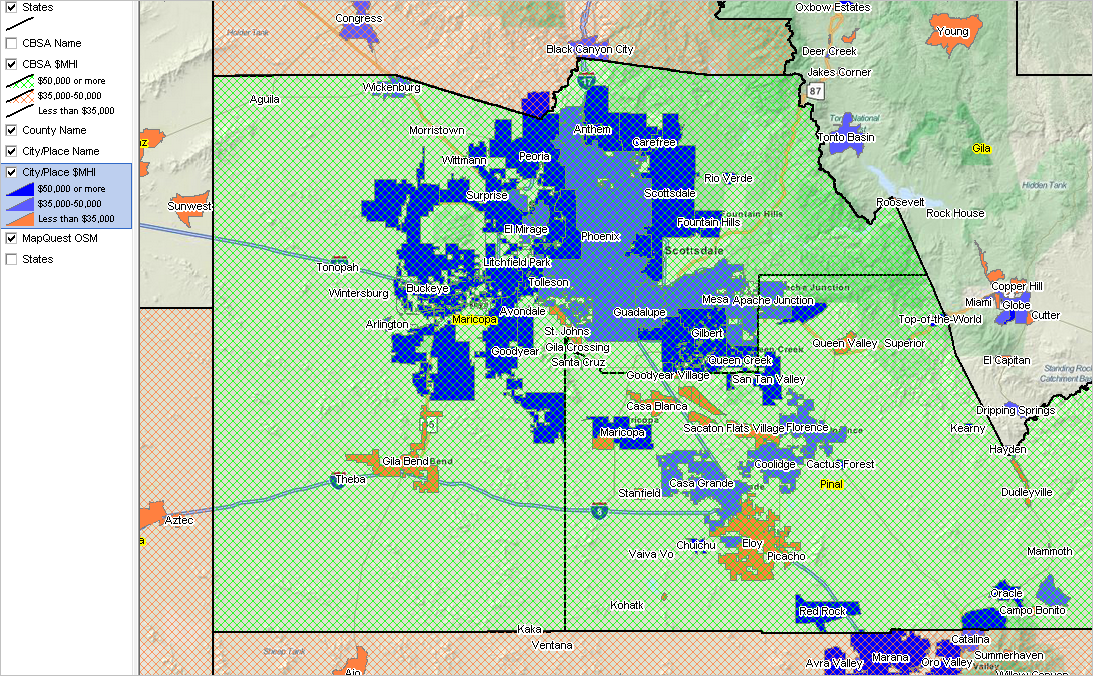
Join the ProximityOne User Group to use this GIS project; add your own data; change colors, labeling, subject matter (join now, no fee). Economic Characteristics Items
EMPLOYMENT STATUS
E001 Population 16 years and over E002 In labor force E003 Civilian labor force E004 Employed E005 Unemployed E006 Armed Forces E007 Not in labor force E008 Civilian labor force E009 Percent Unemployed E010 Females 16 years and over E011 In labor force E012 Civilian labor force E013 Employed E014 Own children under 6 years E015 All parents in family in labor force E016 Own children 6 to 17 years E017 All parents in family in labor force COMMUTING TO WORK E018 Workers 16 years and over E019 Car, truck, or van -- drove alone E020 Car, truck, or van -- carpooled E021 Public transportation (excluding taxicab) E022 Walked E023 Other means E024 Worked at home E025 Mean travel time to work (minutes) OCCUPATION E026 Civilian employed population 16 years and over E027 Management, business, science, and arts occupations E028 Service occupations E029 Sales and office occupations E030 Natural resources, construction, and maintenance occupations E031 Production, transportation, and material moving occupations INDUSTRY E032 Civilian employed population 16 years and over E033 Agriculture, forestry, fishing and hunting, and mining E034 Construction E035 Manufacturing E036 Wholesale trade E037 Retail trade E038 Transportation and warehousing, and utilities E039 Information E040 Finance and insurance, and real estate and rental and leasing E041 Professional, scientific, and management, and administrative and waste management services E042 Educational services, and health care and social assistance E043 Arts, entertainment, and recreation, and accommodation and food services E044 Other services, except public administration E045 Public administration CLASS OF WORKER E046 Civilian employed population 16 years and over E047 Private wage and salary workers E048 Government workers E049 Self-employed in own not incorporated business workers E050 Unpaid family workers INCOME AND BENEFITS (IN 2010 INFLATION-ADJUSTED DOLLARS) E051 Total households E052 Less than $10,000 E053 $10,000 to $14,999 E054 $15,000 to $24,999 E055 $25,000 to $34,999 E056 $35,000 to $49,999 E057 $50,000 to $74,999 E058 $75,000 to $99,999 E059 $100,000 to $149,999 E060 $150,000 to $199,999 E061 $200,000 or more E062 Median household income (dollars) E063 Mean household income (dollars) E064 With earnings E065 Mean earnings (dollars) E066 With Social Security E067 Mean Social Security income (dollars) E068 With retirement income E069 Mean retirement income (dollars) E070 With Supplemental Security Income E071 Mean Supplemental Security Income (dollars) E072 With cash public assistance income E073 Mean cash public assistance income (dollars) E074 With Food Stamp/SNAP benefits in the past 12 months E075 Families E076 Less than $10,000 E077 $10,000 to $14,999 E078 $15,000 to $24,999 E079 $25,000 to $34,999 E080 $35,000 to $49,999 E081 $50,000 to $74,999 E082 $75,000 to $99,999 E083 $100,000 to $149,999 E084 $150,000 to $199,999 E085 $200,000 or more E086 Median family income (dollars) E087 Mean family income (dollars) E088 Per capita income (dollars) E089 Nonfamily households E090 Median nonfamily income (dollars) E091 Mean nonfamily income (dollars) E092 Median earnings for workers (dollars) E093 Median earnings for male full-time, year-round workers (dollars) E094 Median earnings for female full-time, year-round workers (dollars) HEALTH INSURANCE COVERAGE E095 .. Civilian Noninstitutionalized Population E096 .... With health insurance coverage E097 ...... With private health insurance coverage E098 ...... With public health coverage E099 .... No health insurance coverage E100 .... Civilian Noninstitutionalized Population Under 18 years E101 ...... No health insurance coverage E102 .... Civilian noninstitutionalized population 18 to 64 years E103 ...... In labor force: E104 ........ Employed: E105 .......... With health insurance coverage E106 ............ With private health insurance E107 ............ With public coverage E108 .......... No health insurance coverage E109 ........ Unemployed: E110 .......... With health insurance coverage E111 ............ With private health insurance E112 ............ With public coverage E113 .......... No health insurance coverage E114 ...... Not in labor force: E115 ........ With health insurance coverage E116 .......... With private health insurance E117 .......... With public coverage E118 ........ No health insurance coverage PERCENTAGE OF FAMILIES AND PEOPLE WHOSE INCOME IN THE PAST 12 MONTHS IS BELOW THE POVERTY LEVEL E119 All families E120 With related children under 18 years E121 With related children under 5 years only E122 Married couple families E123 With related children under 18 years E124 With related children under 5 years only E125 Families with female householder, no husband present E126 With related children under 18 years E127 With related children under 5 years only E128 All people E129 Under 18 years E130 Related children under 18 years E131 Related children under 5 years E132 Related children 5 to 17 years E133 18 years and over E134 18 to 64 years E135 65 years and over E136 People in families E137 Unrelated individuals 15 years and over City-Place ACS 2012 Demographic-Economic Interactive Tables -- Economic Characteristics Click ShowAll button between Find/Queries. Use mouseover on column header to view column description. See ranking table usage notes below ranking table. See related ranking tables -- http://proximityone.com/rankingtables.htm. ColSet1: $MHI.$MFI.$PCI Usage Notes • GeoType column is not active in this version. • CBSA column is populated only for 2013 vintage CBSA principal cities. -- Get CBSA codes here: http://proximityone.com/metros2013.htm • Click the PrincipalCities button to view only "principal cities." -- see more about principal cities here: http://proximityone.com/principalcities.htm • All items are estimates centric to mid-2010. • Click ShowAll button between specific area queries. • Cells with -1 value could not be estimated (for this geography and this time frame). Use find codes/names to determine census tract, city/place, school district etc. geocode/area name based on address. Importance of these Data The ACS estimates and ProximityOne projections provide "richer" demographic-economic characteristics for national scope cities/places. Census 2010 provides data similar to those items in the General Demographics section. Only the ACS 2011 estimates, ACS 2012 estimates and ProximityOne projections provide details on topics such as income and poverty, labor force and employment, housing value and costs, educational participation and attainment, language spoken at home, among many related items. The approximate 600 items accessible via the dataset are supplemented by a wide range of additional subject matter. Additional Information ProximityOne develops geographic-demographic-economic data and analytical tools and helps organizations knit together and use diverse data in a decision-making and analytical framework. We develop custom demographic/economic estimates and projections, develop geographic and geocoded address files, and assist with impact and geospatial analyses. Wide-ranging organizations use our tools (software, data, methodologies) to analyze their own data integrated with other data. Follow ProximityOne on Twitter at www.twitter.com/proximityone. Contact us (888-364-7656) with questions about data covered in this section or to discuss custom estimates, projections or analyses for your areas of interest. |
|
|