
|
|
|
-- 2008-12 5-Year Estimates There are several things to like about the new American Community Survey 2012 (ACS 2012) 5-year demographic-economic data (available 12/17/13). These data are one year more recent data than released in December 2012 (the ACS 2011 5-year data). As a result, they provide an updated and more current picture. Two, this is a third year sequel to having Census 2010 vintage census tract and block group data available. This de facto three year mini-time series enables a start to examine trends. Three, these estimates are centric to mid-2010 and thus roughly comparable to what would have been "richer demographics" from Census 2010 (had the long-form not been eliminated). This enables a rough comparison between 2000 and 2010 (it will be the best opportunity ever). These data provide unique and powerful measures that facilitate development of decision-making information. This section is focused on ACS 2012 5-year estimates data access and use, applications using these data and the integration and analysis of these data with other data. Census 2010 and ACS 2012 provide the most current Census-sourced demographics for wide-ranging geography. News & Updates -- scroll section
07.30.14. Finding Your Data
... http://proximityone.com/finding_your_data.htm ... locating ACS subject matter ... review of methods & resources to locate specific subject matter ... tools you can use for query & search 07.28.14. ProximityOne Data Services Program ... http://proximityone.com/pds.htm ... linking ACS data with related data resources ... coordinated suite of downloadable datasets ... supported with API data extraction tools 06.20.14. Demographic Economic Data Extraction ... Demographic Economic Data Extraction (DEDE) API tool ... extract multi-sourced demographic economic data ... census block, block group and other geography 06.01.14. Children's Demographic Characteristics by Enrollment Universe ... examine children's demographic economic characteristics by school district. ... more at Children's Demographics; based on ACS school district special tabulation. ... map view: Ohio/adjacent state school districts "%Relevant Children Not Enrolled Ages 5-17" & 113th Congressional Districts ... click graphic for larger view and details. ...  05.16.14. Site Analysis API - access ACS 5 year block group estimates ... access block group data from ACS 2010, 2011, 2012 using API technologies ... optionally aggregate contiguous/non-contiguous block group data ... create reports and downloadable files ... see more ... http://proximityone.com/siteanalysis_api.htm 03.03.14. Neighborhood Patterns GIS Projects ... state by neighborhood GIS projects; no fee usergroup resources ... ready-to-use projects to analyze neighborhood demographic-economic patterns ... http://proximityone.com/neighborhood_patterns.htm  02.10.14. Hispanic Population by Specific Origin by Census Tract & County<br> ... 28 categories of specific origin; GIS and geospatial analysis resources ... interactive table: http://proximityone.com/hso.htm ... Percent Population Mexican Origin -- Los Angeles Area by Tract 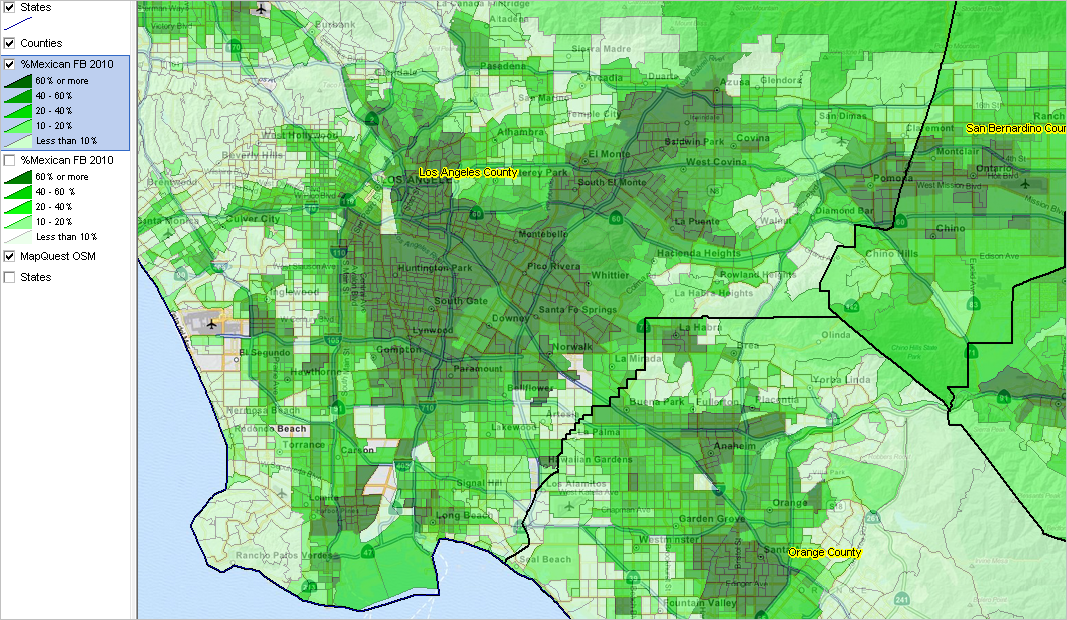
02.07.14. School District Comparative Analysis Profiles ... view comparative analysis report/profile for school districts of interest ... side-by-side comparison of one district with other districts, states, U.S. ... see reports: http://proximityone.com/sddep.htm  02.03.14. Naturally Occurring Retirement Communities ... 10,000+ areas where more than 40% have head of household age 65 years or over ... http://proximityone.com/norc.htm  01.06.14. Mapping Poverty in America - neighborhood drill-down within school district ... mapping poverty by census tract & school district ... see about http://proximityone.com/mapping_poverty.htm & GIS/mapping/geospatial analysis ... create your own custom map views: school districts of interest  12.20.13. Small Area Disability Demographics ... new data & tools to analyze census tract & higher level disability patterns ... determine special needs population by school vicinity & school district ... school age population examples using Houston ISD, TX...see related DMI Blog ... Harris County, TX: 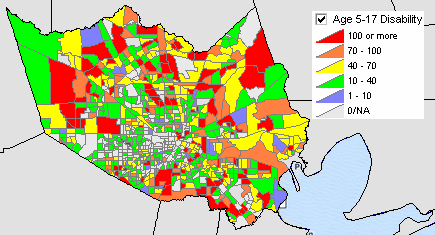 12.15.13. Linguistic Isolation by Block Group ... data & tools to examine households & linguistic isolation measures ... determine multilingual patterns & needs by school vicinity & school district ... examining linguistic isolation patterns by block group ... Queens County, NY: 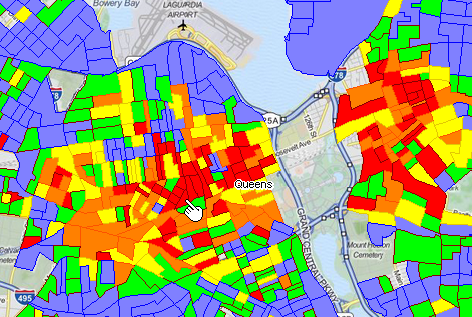 Interactive Ranking Tables -- scroll section
U.S.-State-Metro-County
- General Demographics -- http://proximityone.com/usmc12dp1.htm - Social Characteristics -- http://proximityone.com/usmc12dp2.htm - Economic Characteristics -- http://proximityone.com/usmc12dp3.htm - Housing Characteristics -- http://proximityone.com/usmc12dp4.htm Census Tract - General Demographics -- http://proximityone.com/tracts12dp1.htm - Social Characteristics -- http://proximityone.com/tracts12dp2.htm - Economic Characteristics -- http://proximityone.com/tracts12dp3.htm - Housing Characteristics -- http://proximityone.com/tracts12dp4.htm ZIP Code Area - General Demographics -- http://proximityone.com/zip12dp1.htm - Social Characteristics -- http://proximityone.com/zip12dp2.htm - Economic Characteristics -- http://proximityone.com/zip12dp3.htm - Housing Characteristics -- http://proximityone.com/zip12dp4.htm Cities/Places - General Demographics -- http://proximityone.com/places12dp1.htm - Social Characteristics -- http://proximityone.com/places12dp2.htm - Economic Characteristics -- http://proximityone.com/places12dp3.htm - Housing Characteristics -- http://proximityone.com/places12dp4.htm School Districts - General Demographics -- http://proximityone.com/sd12dp1.htm - Social Characteristics -- http://proximityone.com/sd12dp2.htm - Economic Characteristics -- http://proximityone.com/sd12dp3.htm - Housing Characteristics -- http://proximityone.com/sd12dp4.htm Documentation • 5-Year Estimates Technical Documentation PDF • 5-Year Estimates TableShells XLS API Data Access & Use Use the CV APIGateway to access ACS 2012 5-year estimates by block group (the low level geographic data availability for these data) and higher level geography. Extracted datasets may be integrated directly with shapefiles for thematic mapping and pattern analysis. The graphic shown below illustrates use of ACS 5-year block group data extracted using the APIGateway and integrated into a block group shapefile, all developed with CV XE GIS. Washington DC Area; Median Household Income by BlockGroup 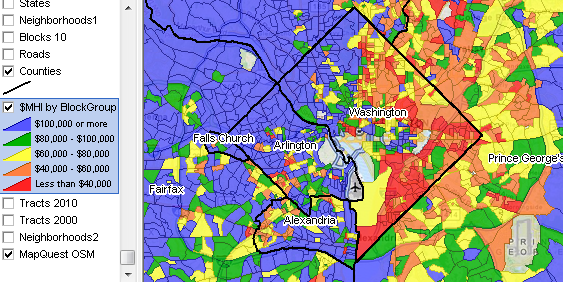
Subject Matter Tables and Data Availability The interactive table below provides a list of all tables included in the 5-year estimates summary file. Use this table to determine availability of subject matter items of interest. ACS 2008-2012 Tables -- Interactive Table Click column header to sort; click again to sort other direction. Click ShowAll between queries. See usage notes below table. See related Ranking Tables Main Page Usage Notes Click ShowAll and then the BG button below the table to view which tables are available for block group level geography. The table initial sort order is the same as in Appendix E of the technical documentation. Sort in table number ascending order by clicking the TableID column header cell. TableIDs ending with PR contain data only for Puerto Rico. About ACS. The American Community Survey (ACS) is a nationwide survey conducted by the Census Bureau designed to provide more frequently updated demographics for national and sub-national geography than provided by the decennial census program. The ACS collects and produces population and housing information every year instead of every ten years The ACS currently has an annual sample size of about 3.5 million addresses. ACS is integrally connected with Census 2010. ProximityOne User Group Join the ProximityOne User Group to keep up-to-date with new developments relating to geographic-demographic-economic decision-making information resources. Receive updates and access to tools and resources available only to members. Use this form to join the User Group. There is no fee. Support Using these Resources Learn more about accessing, integrating and using ACS data. Join us in a Decision-Making Information Web session. There is no fee for these one-hour Web sessions. Each informal session is focused on a specific topic. The open structure also provides for Q&A and discussion of application issues of interest to participants. Additional Information ProximityOne develops geographic-demographic-economic data and analytical tools and helps organizations knit together and use diverse data in a decision-making and analytical framework. We develop custom demographic/economic estimates and projections, develop geographic and geocoded address files, and assist with impact and geospatial analyses. Wide-ranging organizations use our tools (software, data, methodologies) to analyze their own data integrated with other data. Follow ProximityOne on Twitter at www.twitter.com/proximityone. Contact us (888-364-7656) with questions about data covered in this section or to discuss custom estimates, projections or analyses for your areas of interest. |
|
|