|
|
Decision-Making Information

|
ProximityOne
information resources & solutions
(888) DMI-SOLN
(888) 364-7656
Visual analysis with ProximityOne tools
click graphic for info; hover to pause
Data Analytics Blog
Mapping Statistical Data
Support & Technical Assistance
help using these resources
|
Naturally Occurring Retirement Communities -- NORCs
-- assessing distribution and characteristics & tools for analysis
As of 2010, 25.8 million U.S. households had a head of household age 65 years or over; 22.1% of total households.
3.1 million households with head of household 65 years or over were
located in 10,201 "naturally occurring retirement communities" (NORCs) -- areas where the percent of
head of household age 65 or over is 40 percent or more.
Will the number of NORCs triple by 2020?
See related updated/extended section on Naturally Occurring Retirement Communities.
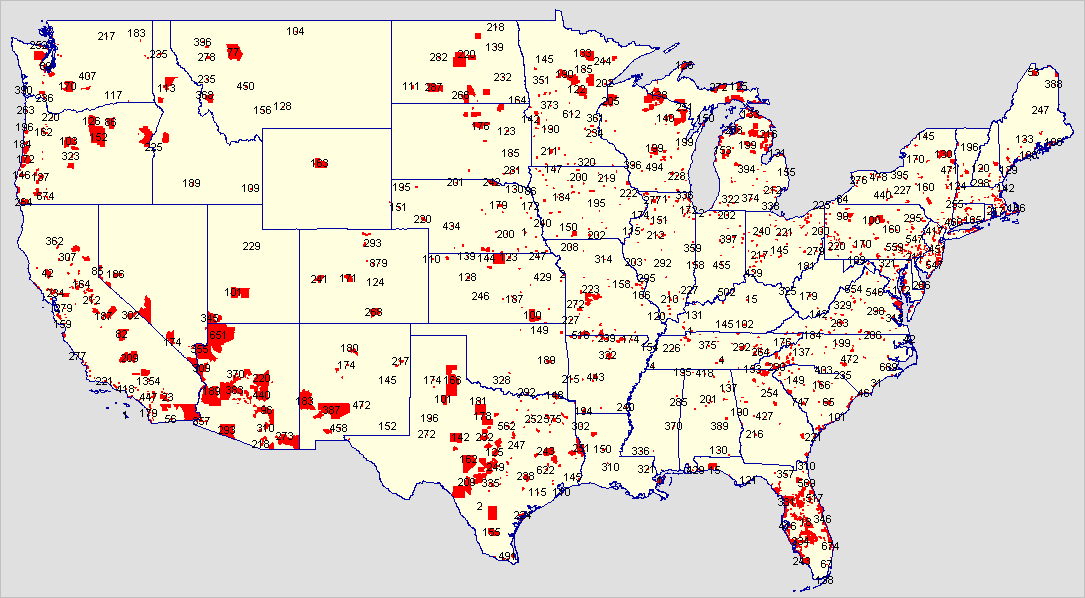
Naturally Occurring Retirement Communities, 2010 (red fill pattern)
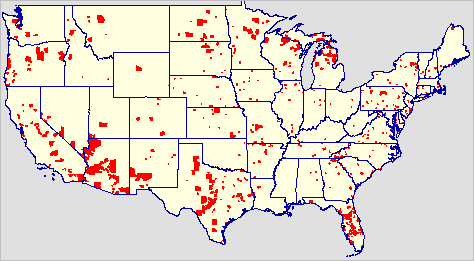
Click graphic for larger view labeled with number of NORC households.
A naturally occurring retirement community (NORC) is an area that naturally evolves over time to
include a relatively large concentration of households where the householder is 65 years or older.
NORCs evolve in or as neighborhoods generally on an unplanned basis.
How are the more than 26 million households distributed as NORCs? How are they similar or dissimilar?
What special needs do the population of some NORCs have compared to others?
How will the evolvement of NORCs affect our society?
This section is focused on U.S. national scope analysis of the size, distribution and characteristics of NORCs.
Though unplanned, NORCs will continue to evolve as habitats that require decision-making information for planning.
Residents of NORCs may have requirements/needs that differ from other areas.
These include transportation,
social and education,
assistance with household maintenance,
healthcare and security.
Demographics can help us assess the nature and magnitude of some of these needs and plan for improved solutions.
As of Census 2010, 25,819,836 households had a head of household age 65 years or over; 22.1% of total households.
The Census 2010 U.S. size and distribution of households (occupied housing units) by age of head of householder is shown
in the Summary File 1 Table 17 Tenure by Age of Householder.
Using data from this table, households by tenure and different categories for age of head of household can be used in analyses.
| Total households: | 116,716,292 |
| Owner occupied: | 75,986,074 |
| Householder 15 to 24 years | 869,610 |
| Householder 25 to 34 years | 7,547,421 |
| Householder 35 to 44 years | 13,255,629 |
| Householder 45 to 54 years | 17,804,066 |
| Householder 55 to 59 years | 8,626,564 |
| Householder 60 to 64 years | 7,876,168 |
| Householder 65 to 74 years | 10,834,028 |
| Householder 75 to 84 years | 6,788,967 |
| Householder 85 years and over | 2,383,621 |
| Renter occupied: | 40,730,218 |
| Householder 15 to 24 years | 4,531,189 |
| Householder 25 to 34 years | 10,409,954 |
| Householder 35 to 44 years | 8,035,251 |
| Householder 45 to 54 years | 7,102,998 |
| Householder 55 to 59 years | 2,701,749 |
| Householder 60 to 64 years | 2,135,857 |
| Householder 65 to 74 years | 2,670,489 |
| Householder 75 to 84 years | 1,927,400 |
| Householder 85 years and over | 1,215,331 |
NORCs & Block Group Demographics
Census block groups (BGs) are used to equivalence
NORCs. Block groups average 1,500 in population and cover the U.S. wall-to-wall.
Using a ProximityOne API, a dataset
was developed containing the Census 2010 Table H17 data for each of the approximate 217,000 BGs.
Those data were integrated into a national scope
block group shapefile for mapping and geospatial analysis.
In 2010, 3.1 million households with head of household 65 years or over were
located in 10,201 NORCs/BGs where the percent of head of households age 65 years and over is 40 percent or more.
Each NORC/BG averages 307 households in this group.
Households versus Families
A family consists of two or more people (one of whom is the householder) related by birth, marriage, or adoption residing in the same housing unit. A household consists of all people who occupy a housing unit regardless of relationship. A household may consist of a person living alone or multiple unrelated individuals or families living together.
NORC Patterns and Visual Analysis
The illustrative views presented in the following scroll section were developed using the
CV XE GIS and NORC GIS project.
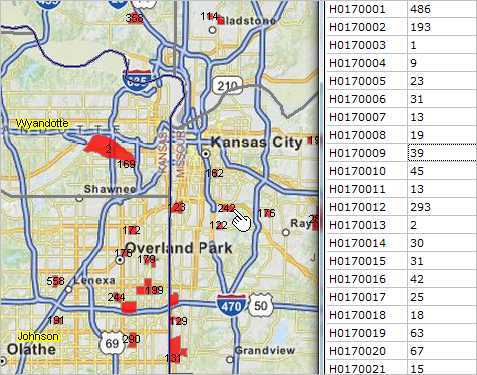
Kansas City area graphic (last in scroll section) shows mini-profile/datatable for a selected NORC/BG.
Labels show the number of households in that NORC/BG with head of household age 65 or older as of Census 2010.
For larger expanse views, labels may obscure actual NORC/BG area.
Zoom-in views are enabled using GIS tools described below which allow you to depict small areas in great detail with streets, etc.
Scroll section ... use scroll bar at right
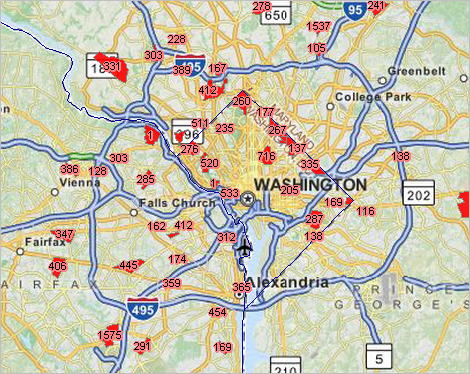
Washington, DC area NORCs, 2010 (red fill pattern)
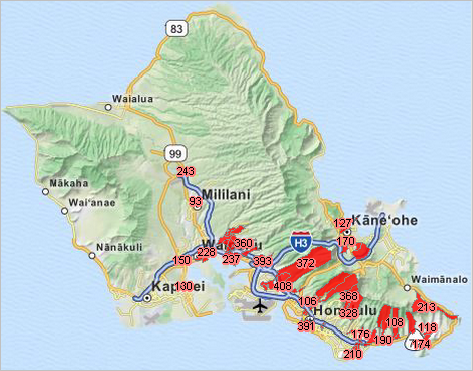
 Honolulu, HI area NORCs, 2010
 (red fill pattern)
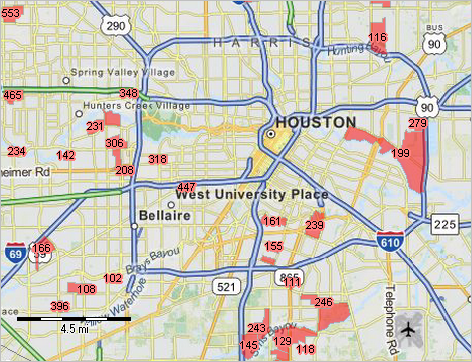
 Houston, TX area NORCs, 2010
 (red fill pattern)
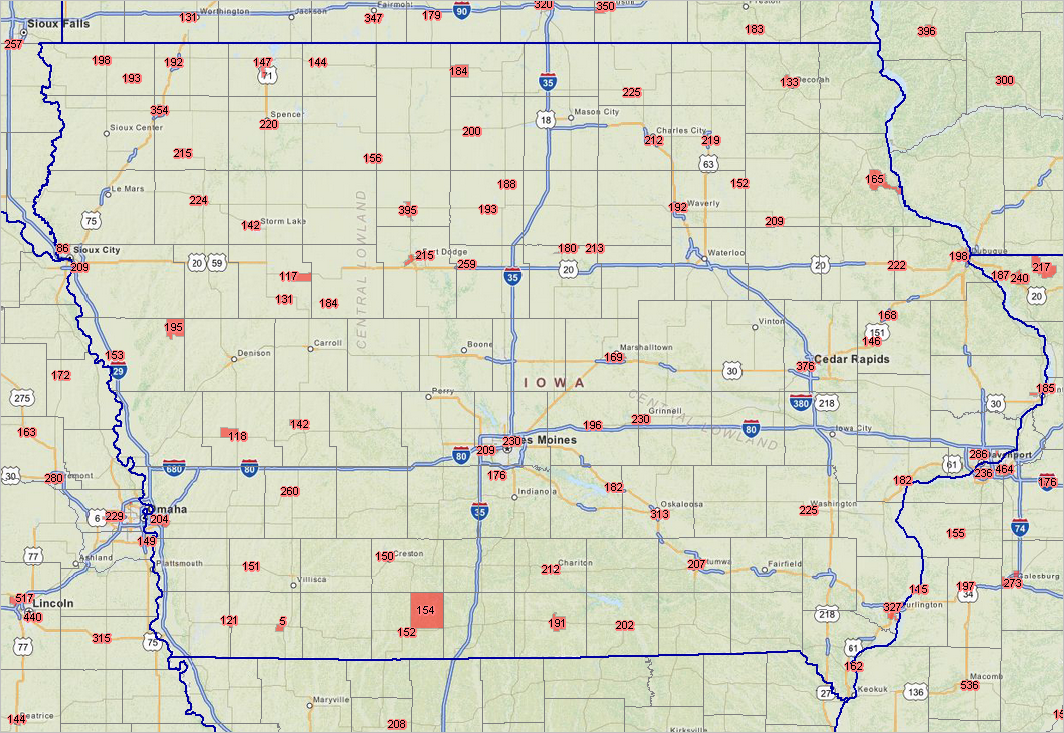
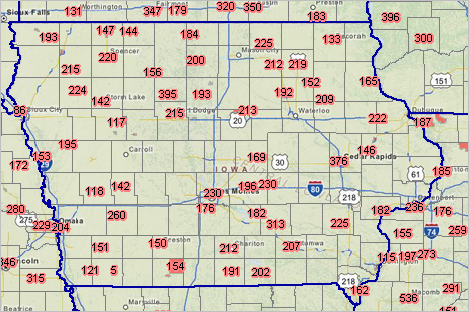
 Iowa NORCs, 2010
 (red fill pattern; click graphic for larger view)
 Kansas City, MO-KS area NORCs, 2010
 (red fill pattern)
This view shows a mini-profile for a selected NORC (see pointer).
The profile shows the 21 data field values from Census 2010 Summary File 1 Table H017 for this NORC/BG.
NORC/BG Richer Demographics
As of 2014, the Census 2010 demographics are the most up-to-date and accurate data available for block groups.
The related American Community Survey (ACS) 5-year estimates are available at the block group level and provide
"richer demographics" compared with data available through Census 2010.
The 2012 ACS 5-year estimates (latest available until December 2014) are centric to mid-2010.
The ACS 5-year estimates can provide insights into employment, income, poverty, language spoken, educational attainment, disabilities,
among other relevant measures.
Comparative Analysis Block Group Demographic-Economic Profile (scroll section)
Some NORCs are combinations of contiguous BGs. The following scroll section shows Kansas City area
BGs 29-095-007300-3, 29-095-007400-2, 29-095-007400-3 and summary for the custom-defined area.
The profile is generated with
CV XE GIS; available for any combination of block groups nationally.
| Geographic Area | 29-095-007300-3 | 29-095-007400-2 | 29-095-007400-3 | Summary |
| Description | Value | Percent | Value | Percent | Value | Percent | Value | Percent |
| d001 | Total Population by Gender & Age (B01001) | 946 | 100.00 | 792 | 100.00 | 865 | 100.00 | 2,603 | 100.0 |
| d002 | .. Male | 577 | 60.99 | 412 | 52.02 | 296 | 34.22 | 1,285 | 49.4 |
| d003 | .. Female | 369 | 39.01 | 380 | 47.98 | 569 | 65.78 | 1,318 | 50.6 |
| d004 | .. Under 5 years | 0 | 0.00 | 8 | 1.01 | 33 | 3.82 | 41 | 1.6 |
| d005 | .. 5 to 9 years | 0 | 0.00 | 0 | 0.00 | 0 | 0.00 | 0 | 0.0 |
| d006 | .. 10 to 14 years | 0 | 0.00 | 0 | 0.00 | 15 | 1.73 | 15 | 0.6 |
| d007 | .. 15 to 17 years | 0 | 0.00 | 0 | 0.00 | 0 | 0.00 | 0 | 0.0 |
| d008 | .. 18 and 19 years | 0 | 0.00 | 46 | 5.81 | 141 | 16.30 | 187 | 7.2 |
| d009 | .. 20 years | 0 | 0.00 | 94 | 11.87 | 0 | 0.00 | 94 | 3.6 |
| d010 | .. 21 years | 0 | 0.00 | 47 | 5.93 | 0 | 0.00 | 47 | 1.8 |
| d011 | .. 22 to 24 years | 94 | 9.94 | 148 | 18.69 | 73 | 8.44 | 315 | 12.1 |
| d012 | .. 25 to 29 years | 146 | 15.43 | 227 | 28.66 | 29 | 3.35 | 402 | 15.4 |
| d013 | .. 30 to 34 years | 98 | 10.36 | 42 | 5.30 | 108 | 12.49 | 248 | 9.5 |
| d014 | .. 35 to 39 years | 55 | 5.81 | 10 | 1.26 | 24 | 2.77 | 89 | 3.4 |
| d015 | .. 40 to 44 years | 58 | 6.13 | 43 | 5.43 | 29 | 3.35 | 130 | 5.0 |
| d016 | .. 45 to 49 years | 91 | 9.62 | 32 | 4.04 | 42 | 4.86 | 165 | 6.3 |
| d017 | .. 50 to 54 years | 88 | 9.30 | 3 | 0.38 | 117 | 13.53 | 208 | 8.0 |
| d018 | .. 55 to 59 years | 29 | 3.07 | 34 | 4.29 | 46 | 5.32 | 109 | 4.2 |
| d019 | .. 60 and 61 years | 9 | 0.95 | 0 | 0.00 | 16 | 1.85 | 25 | 1.0 |
| d020 | .. 62 to 64 years | 14 | 1.48 | 0 | 0.00 | 32 | 3.70 | 46 | 1.8 |
| d021 | .. 65 and 66 years | 10 | 1.06 | 35 | 4.42 | 36 | 4.16 | 81 | 3.1 |
| d022 | .. 67 to 69 years | 18 | 1.90 | 10 | 1.26 | 12 | 1.39 | 40 | 1.5 |
| d023 | .. 70 to 74 years | 88 | 9.30 | 0 | 0.00 | 30 | 3.47 | 118 | 4.5 |
| d024 | .. 75 to 79 years | 68 | 7.19 | 12 | 1.52 | 0 | 0.00 | 80 | 3.1 |
| d025 | .. 80 to 84 years | 36 | 3.81 | 0 | 0.00 | 46 | 5.32 | 82 | 3.2 |
| d026 | .. 85 years and over | 44 | 4.65 | 1 | 0.13 | 36 | 4.16 | 81 | 3.1 |
| d027 | .. Median age | 47.2 | ... | 26.6 | ... | 42.6 | ... | 38.8 | ... |
| Race (B02001) & Origin (B03003) | | | | | | | | |
| d028 | Total Population | 946 | 100.00 | 792 | 100.00 | 865 | 100.00 | 2,603 | 100.0 |
| d029 | .. White alone | 766 | 80.97 | 615 | 77.65 | 776 | 89.71 | 2,157 | 82.9 |
| d030 | .. Black or African American alone | 84 | 8.88 | 14 | 1.77 | 0 | 0.00 | 98 | 3.8 |
| d031 | .. American Indian and Alaska Native alone | 0 | 0.00 | 0 | 0.00 | 47 | 5.43 | 47 | 1.8 |
| d032 | .. Asian alone | 83 | 8.77 | 163 | 20.58 | 26 | 3.01 | 272 | 10.4 |
| d033 | .. Native Hawaiian & Other Pacific Islander alone | 0 | 0.00 | 0 | 0.00 | 0 | 0.00 | 0 | 0.0 |
| d034 | .. Some other race alone | 13 | 1.37 | 0 | 0.00 | 16 | 1.85 | 29 | 1.1 |
| d035 | .. Two or more races | 0 | 0.00 | 0 | 0.00 | 0 | 0.00 | 0 | 0.0 |
| d036 | .. Hispanic (B03003) | 13 | 1.37 | 9 | 1.14 | 78 | 9.02 | 100 | 3.8 |
| Households by Type (B11001) | | | | | | | | |
| d037 | Total Households | 748 | 100.00 | 440 | 100.00 | 499 | 100.00 | 1,687 | 100.0 |
| d038 | .. Family households | 172 | 22.99 | 45 | 10.23 | 184 | 36.87 | 401 | 23.8 |
| d039 | .... Married couple family | 163 | 21.79 | 45 | 10.23 | 135 | 27.05 | 343 | 20.3 |
| d040 | .... Other family | 9 | 1.20 | 0 | 0.00 | 49 | 9.82 | 58 | 3.4 |
| d041 | ...... Male householder, no wife present | 0 | 0.00 | 0 | 0.00 | 27 | 5.41 | 27 | 1.6 |
| d042 | ...... Female householder, no husband present | 9 | 1.20 | 0 | 0.00 | 22 | 4.41 | 31 | 1.8 |
| d043 | .. Nonfamily households | 576 | 77.01 | 395 | 89.77 | 315 | 63.13 | 1,286 | 76.2 |
| d044 | .... Householder living alone | 561 | 75.00 | 238 | 54.09 | 199 | 39.88 | 998 | 59.2 |
| d045 | .... Householder not living alone | 15 | 2.01 | 157 | 35.68 | 116 | 23.25 | 288 | 17.1 |
| d046 | Households with children under 18 years (B11005) | 0 | 0.00 | 8 | 1.82 | 42 | 8.42 | 50 | 3.0 |
| d047 | Households with persons 65 yrs or over (B11007) | 158 | 21.12 | 45 | 10.23 | 147 | 29.46 | 350 | 20.7 |
| d048 | Average Household Size (B25010/H012) | 1.26 | ... | 1.63 | ... | 1.73 | ... | 1.54 | ... |
| d049 | Average Household Size -- owner occupied | 1.47 | ... | 1.69 | ... | 1.50 | ... | 1.55 | ... |
| d050 | Average Household Size -- renter occupied | 1.10 | ... | 1.60 | ... | 1.88 | ... | 1.53 | ... |
| d050a | Population in Households (B11002/P029) | 946 | 100.00 | 718 | 90.66 | 865 | 100.00 | 2,529 | 97.2 |
| School Enrollment | | | | | | | | |
| d051 | Population 3 years and over | 946 | 100.00 | 784 | 100.00 | 845 | 100.00 | 2,575 | 100.0 |
| d052 | .. Enrolled in school: | 126 | 13.32 | 371 | 47.32 | 263 | 31.12 | 760 | 29.5 |
| d053 | .. Enrolled in nursery school, preschool | 0 | 0.00 | 0 | 0.00 | 13 | 1.54 | 13 | 0.5 |
| d054 | .... Public school | 0 | 0.00 | 0 | 0.00 | 0 | 0.00 | 0 | 0.0 |
| d055 | .... Private school | 0 | 0.00 | 0 | 0.00 | 13 | 1.54 | 13 | 0.5 |
| d056 | .. Enrolled in kindergarten: | 0 | 0.00 | 0 | 0.00 | 0 | 0.00 | 0 | 0.0 |
| d057 | .... Public school | 0 | 0.00 | 0 | 0.00 | 0 | 0.00 | 0 | 0.0 |
| d058 | .... Private school | 0 | 0.00 | 0 | 0.00 | 0 | 0.00 | 0 | 0.0 |
| d059 | .. Enrolled in grade 1 to grade 4: | 0 | 0.00 | 0 | 0.00 | 0 | 0.00 | 0 | 0.0 |
| d060 | .... Public school | 0 | 0.00 | 0 | 0.00 | 0 | 0.00 | 0 | 0.0 |
| d061 | .... Private school | 0 | 0.00 | 0 | 0.00 | 0 | 0.00 | 0 | 0.0 |
| d062 | .. Enrolled in grade 5 to grade 8: | 0 | 0.00 | 0 | 0.00 | 15 | 1.78 | 15 | 0.6 |
| d063 | .... Public school | 0 | 0.00 | 0 | 0.00 | 0 | 0.00 | 0 | 0.0 |
| d064 | .... Private school | 0 | 0.00 | 0 | 0.00 | 15 | 1.78 | 15 | 0.6 |
| d065 | .. Enrolled in grade 9 to grade 12: | 0 | 0.00 | 9 | 1.15 | 0 | 0.00 | 9 | 0.3 |
| d066 | .... Public school | 0 | 0.00 | 0 | 0.00 | 0 | 0.00 | 0 | 0.0 |
| d067 | .... Private school | 0 | 0.00 | 9 | 1.15 | 0 | 0.00 | 9 | 0.3 |
| d068 | .. Enrolled in college undergraduate | 98 | 10.36 | 138 | 17.60 | 150 | 17.75 | 386 | 15.0 |
| d069 | .... Public school | 98 | 10.36 | 53 | 6.76 | 9 | 1.07 | 160 | 6.2 |
| d070 | .... Private school | 0 | 0.00 | 85 | 10.84 | 141 | 16.69 | 226 | 8.8 |
| d071 | .. Enrolled in graduate or profession | 28 | 2.96 | 224 | 28.57 | 85 | 10.06 | 337 | 13.1 |
| d072 | .... Public school | 0 | 0.00 | 141 | 17.98 | 85 | 10.06 | 226 | 8.8 |
| d073 | .... Private school | 28 | 2.96 | 83 | 10.59 | 0 | 0.00 | 111 | 4.3 |
| d074 | .. Not enrolled in school | 820 | 86.68 | 413 | 52.68 | 582 | 68.88 | 1,815 | 70.5 |
| Educational Attainment (B15002) | | | | | | | | |
| d075 | Population 25 years and over | 852 | 100.00 | 449 | 100.00 | 603 | 100.00 | 1,904 | 100.0 |
| d076 | .. No schooling completed | 0 | 0.00 | 0 | 0.00 | 0 | 0.00 | 0 | 0.0 |
| d077 | .. Nursery to 4th Grade | 0 | 0.00 | 0 | 0.00 | 0 | 0.00 | 0 | 0.0 |
| d078 | .. 5th and 6th Grade | 0 | 0.00 | 0 | 0.00 | 0 | 0.00 | 0 | 0.0 |
| d079 | .. 7th and 8th Grade | 0 | 0.00 | 1 | 0.22 | 0 | 0.00 | 1 | 0.1 |
| d080 | .. 9th Grade | 0 | 0.00 | 0 | 0.00 | 7 | 1.16 | 7 | 0.4 |
| d081 | .. 10th Grade | 0 | 0.00 | 9 | 2.00 | 0 | 0.00 | 9 | 0.5 |
| d082 | .. 11th Grade | 0 | 0.00 | 0 | 0.00 | 0 | 0.00 | 0 | 0.0 |
| d083 | .. 12th, no diploma | 0 | 0.00 | 12 | 2.67 | 0 | 0.00 | 12 | 0.6 |
| d084 | .. High School Graduate, GED, or alternative | 51 | 5.99 | 16 | 3.56 | 78 | 12.94 | 145 | 7.6 |
| d085 | .. Some college, less than 1 year | 0 | 0.00 | 0 | 0.00 | 12 | 1.99 | 12 | 0.6 |
| d086 | .. Some college, 1 or more years, no degree | 108 | 12.68 | 95 | 21.16 | 99 | 16.42 | 302 | 15.9 |
| d087 | .. Associate's degree | 53 | 6.22 | 17 | 3.79 | 44 | 7.30 | 114 | 6.0 |
| d088 | .. Bachelor's degree | 283 | 33.22 | 121 | 26.95 | 121 | 20.07 | 525 | 27.6 |
| d089 | .. Master's degree | 222 | 26.06 | 145 | 32.29 | 158 | 26.20 | 525 | 27.6 |
| d090 | .. Professional school degree | 120 | 14.08 | 24 | 5.35 | 60 | 9.95 | 204 | 10.7 |
| d091 | .. Doctorate degree | 15 | 1.76 | 9 | 2.00 | 24 | 3.98 | 48 | 2.5 |
| Language Spoken at Home (B16004) | | | | | | | | |
| d092 | Population 5 years and over | 946 | 100.00 | 784 | 100.00 | 832 | 100.00 | 2,562 | 100.0 |
| d093 | .. Population 5 to 17 years: | 0 | 0.00 | 0 | 0.00 | 15 | 1.80 | 15 | 0.6 |
| d094 | .. Speak only English | 0 | 0.00 | 0 | 0.00 | 15 | 1.80 | 15 | 0.6 |
| d095 | .. Speak Spanish: | 0 | 0.00 | 0 | 0.00 | 0 | 0.00 | 0 | 0.0 |
| d096 | .... Speak English "not well" | 0 | 0.00 | 0 | 0.00 | 0 | 0.00 | 0 | 0.0 |
| d097 | .... Speak English "not at all" | 0 | 0.00 | 0 | 0.00 | 0 | 0.00 | 0 | 0.0 |
| d098 | .. Speak other Indo-European languages: | 0 | 0.00 | 0 | 0.00 | 0 | 0.00 | 0 | 0.0 |
| d099 | .... Speak English "not well" | 0 | 0.00 | 0 | 0.00 | 0 | 0.00 | 0 | 0.0 |
| d100 | .... Speak English "not at all" | 0 | 0.00 | 0 | 0.00 | 0 | 0.00 | 0 | 0.0 |
| d101 | .. Speak Asian and Pacific Island languages: | 0 | 0.00 | 0 | 0.00 | 0 | 0.00 | 0 | 0.0 |
| d102 | .... Speak English "not well" | 0 | 0.00 | 0 | 0.00 | 0 | 0.00 | 0 | 0.0 |
| d103 | .... Speak English "not at all" | 0 | 0.00 | 0 | 0.00 | 0 | 0.00 | 0 | 0.0 |
| d104 | .. Speak other languages: | 0 | 0.00 | 0 | 0.00 | 0 | 0.00 | 0 | 0.0 |
| d105 | .... Speak English "not well" | 0 | 0.00 | 0 | 0.00 | 0 | 0.00 | 0 | 0.0 |
| d106 | .... Speak English "not at all" | 0 | 0.00 | 0 | 0.00 | 0 | 0.00 | 0 | 0.0 |
| Household Income Past 12 Months (B19001) | | | | | | | | |
| d107 | Households | 748 | 100.00 | 440 | 100.00 | 499 | 100.00 | 1,687 | 100.0 |
| d108 | .. Less than $10,000 | 96 | 12.83 | 107 | 24.32 | 72 | 14.43 | 275 | 16.3 |
| d109 | .. $10,000 to $14,999 | 0 | 0.00 | 0 | 0.00 | 10 | 2.00 | 10 | 0.6 |
| d110 | .. $15,000 to $19,999 | 31 | 4.14 | 57 | 12.95 | 23 | 4.61 | 111 | 6.6 |
| d111 | .. $20,000 to $24,999 | 40 | 5.35 | 29 | 6.59 | 70 | 14.03 | 139 | 8.2 |
| d112 | .. $25,000 to $29,999 | 45 | 6.02 | 9 | 2.05 | 0 | 0.00 | 54 | 3.2 |
| d113 | .. $30,000 to $34,999 | 72 | 9.63 | 0 | 0.00 | 25 | 5.01 | 97 | 5.7 |
| d114 | .. $35,000 to $39,999 | 0 | 0.00 | 30 | 6.82 | 0 | 0.00 | 30 | 1.8 |
| d115 | .. $40,000 to $44,999 | 11 | 1.47 | 0 | 0.00 | 17 | 3.41 | 28 | 1.7 |
| d116 | .. $45,000 to $49,999 | 15 | 2.01 | 37 | 8.41 | 10 | 2.00 | 62 | 3.7 |
| d117 | .. $50,000 to $59,999 | 30 | 4.01 | 27 | 6.14 | 14 | 2.81 | 71 | 4.2 |
| d118 | .. $60,000 to $74,999 | 56 | 7.49 | 36 | 8.18 | 63 | 12.63 | 155 | 9.2 |
| d119 | .. $75,000 to $99,999 | 40 | 5.35 | 52 | 11.82 | 0 | 0.00 | 92 | 5.5 |
| d120 | .. $100,000 to $124,999 | 9 | 1.20 | 21 | 4.77 | 20 | 4.01 | 50 | 3.0 |
| d121 | .. $125,000 to $149,999 | 58 | 7.75 | 0 | 0.00 | 47 | 9.42 | 105 | 6.2 |
| d122 | .. $150,000 to $199,999 | 84 | 11.23 | 18 | 4.09 | 8 | 1.60 | 110 | 6.5 |
| d123 | .. $200,000 or more | 161 | 21.52 | 17 | 3.86 | 120 | 24.05 | 298 | 17.7 |
| d124 | .. Median Household Income (B19003) | 73,333 | ... | 37,045 | ... | 60,817 | ... | 57,065 | |
| Other Income and Poverty Measures | | | | | | | | |
| d125 | .. Median Family Income (B19113) | 156,023 | ... | 74,896 | ... | 69,500 | ... | 100,140 | |
| d126 | .. Per Capita Income (B19301) | 91,290 | ... | 30,769 | ... | 82,077 | ... | 68,045 | |
| d127 | .. All families (B17010) | 172 | 100.00 | 45 | 100.00 | 184 | 100.00 | 401 | 100.0 |
| d128 | .... With income past 12 months below poverty leve | 0 | 0.00 | 0 | 0.00 | 32 | 17.39 | 32 | 8.0 |
| d129 | ...... Married-couple family (in poverty) | 0 | 0.00 | 0 | 0.00 | 10 | 5.43 | 10 | 2.5 |
| d130 | ........ With related children under 18 yrs | 0 | 0.00 | 0 | 0.00 | 0 | 0.00 | 0 | 0.0 |
| Employment Status (B23025) | | | | | | | | |
| d133 | Population 16 years and over | 946 | 100.00 | 784 | 100.00 | 817 | 100.00 | 2,547 | 100.0 |
| d134 | .. In labor force | 702 | 74.21 | 585 | 74.62 | 603 | 73.81 | 1,890 | 74.2 |
| d135 | .... In Armed Forces | 0 | 0.00 | 0 | 0.00 | 0 | 0.00 | 0 | 0.0 |
| d136 | .... Civilian | 702 | 74.21 | 585 | 74.62 | 603 | 73.81 | 1,890 | 74.2 |
| d137 | ...... Employed | 579 | 61.21 | 573 | 73.09 | 480 | 58.75 | 1,632 | 64.1 |
| d138 | ...... Unemployed | 123 | 13.00 | 12 | 1.53 | 123 | 15.06 | 258 | 10.1 |
| d139 | .. Not in labor force | 244 | 25.79 | 199 | 25.38 | 214 | 26.19 | 657 | 25.8 |
| d140 | Housing Units (B25001) | 828 | 100.00 | 531 | 100.00 | 567 | 100.00 | 1,926 | |
| d141 | .. Occupied housing units | 748 | 90.34 | 440 | 82.86 | 499 | 88.01 | 1,687 | 87.6 |
| d142 | .... Owner-occupied housing units | 327 | 39.49 | 173 | 32.58 | 195 | 34.39 | 695 | 36.1 |
| d143 | .... Renter-occupied housing units | 421 | 50.85 | 267 | 50.28 | 304 | 53.62 | 992 | 51.5 |
| d144 | .. Vacant housing units | 80 | 9.66 | 91 | 17.14 | 68 | 11.99 | 239 | 12.4 |
| d145 | .... For Rent | 0 | 0.00 | 91 | 17.14 | 0 | 0.00 | 91 | 4.7 |
| d146 | .... For seasonal, recreational, occasional use | 41 | 4.95 | 0 | 0.00 | 0 | 0.00 | 41 | 2.1 |
| Units in Structure (B25024) | | | | | | | | 0.0 |
| d147 | Total Housing Units | 828 | 100.00 | 531 | 100.00 | 567 | 100.00 | 1,926 | 100.0 |
| d148 | .. 1, detached | 23 | 2.78 | 96 | 18.08 | 39 | 6.88 | 158 | 8.2 |
| d149 | .. 1, attached | 49 | 5.92 | 12 | 2.26 | 15 | 2.65 | 76 | 3.9 |
| d150 | .. 2 | 12 | 1.45 | 20 | 3.77 | 0 | 0.00 | 32 | 1.7 |
| d151 | .. 3 or 4 | 0 | 0.00 | 171 | 32.20 | 130 | 22.93 | 301 | 15.6 |
| d152 | .. 5 to 9 | 0 | 0.00 | 46 | 8.66 | 110 | 19.40 | 156 | 8.1 |
| d153 | .. 10 to 19 | 0 | 0.00 | 83 | 15.63 | 45 | 7.94 | 128 | 6.6 |
| d154 | .. 20 to 49 | 94 | 11.35 | 78 | 14.69 | 111 | 19.58 | 283 | 14.7 |
| d155 | .. 50 or more | 650 | 78.50 | 25 | 4.71 | 117 | 20.63 | 792 | 41.1 |
| d156 | .. Mobile home | 0 | 0.00 | 0 | 0.00 | 0 | 0.00 | 0 | 0.0 |
| d157 | .. Boat, RV, van, etc. | 0 | 0.00 | 0 | 0.00 | 0 | 0.00 | 0 | 0.0 |
| Year Structure Built (B25024) | | | | | | | | |
| d158 | Total Housing Units | 828 | 100.00 | 531 | 100.00 | 567 | 100.00 | 1,926 | 100.0 |
| d159 | .. Built 2005 or later | 10 | 1.21 | 14 | 2.64 | 112 | 19.75 | 136 | 7.1 |
| d160 | .. Built 2000 to 2004 | 0 | 0.00 | 0 | 0.00 | 96 | 16.93 | 96 | 5.0 |
| d161 | .. Built 1990 to 1999 | 9 | 1.09 | 8 | 1.51 | 11 | 1.94 | 28 | 1.5 |
| d162 | .. Built 1980 to 1989 | 15 | 1.81 | 39 | 7.34 | 0 | 0.00 | 54 | 2.8 |
| d163 | .. Built 1970 to 1979 | 86 | 10.39 | 93 | 17.51 | 16 | 2.82 | 195 | 10.1 |
| d164 | .. Built 1960 to 1969 | 187 | 22.58 | 95 | 17.89 | 62 | 10.93 | 344 | 17.9 |
| d165 | .. Built 1950 to 1959 | 53 | 6.40 | 8 | 1.51 | 48 | 8.47 | 109 | 5.7 |
| d166 | .. Built 1940 to 1949 | 41 | 4.95 | 55 | 10.36 | 19 | 3.35 | 115 | 6.0 |
| d167 | .. Built 1939 or earlier | 427 | 51.57 | 219 | 41.24 | 203 | 35.80 | 849 | 44.1 |
| d168 | Median Year Structure Built | 1,939 | ... | 1,948 | ... | 1,962 | ... | 1,950 | |
| Value (B25075) | | | | | | | | |
| d169 | Owner-Occupied Housing Units | 327 | 100.00 | 173 | 100.00 | 195 | 100.00 | 695 | 100.0 |
| d170 | .. Less than $10,000 | 0 | 0.00 | 0 | 0.00 | 0 | 0.00 | 0 | 0.0 |
| d171 | .. $10,000 to $14,999 | 0 | 0.00 | 0 | 0.00 | 0 | 0.00 | 0 | 0.0 |
| d172 | .. $15,000 to $19,999 | 0 | 0.00 | 0 | 0.00 | 0 | 0.00 | 0 | 0.0 |
| d173 | .. $20,000 to $24,999 | 0 | 0.00 | 0 | 0.00 | 0 | 0.00 | 0 | 0.0 |
| d174 | .. $25,000 to $29,999 | 0 | 0.00 | 0 | 0.00 | 0 | 0.00 | 0 | 0.0 |
| d175 | .. $30,000 to $34,999 | 0 | 0.00 | 0 | 0.00 | 0 | 0.00 | 0 | 0.0 |
| d176 | .. $35,000 to $39,999 | 0 | 0.00 | 0 | 0.00 | 0 | 0.00 | 0 | 0.0 |
| d177 | .. $40,000 to $49,999 | 0 | 0.00 | 0 | 0.00 | 0 | 0.00 | 0 | 0.0 |
| d178 | .. $50,000 to $59,999 | 0 | 0.00 | 0 | 0.00 | 0 | 0.00 | 0 | 0.0 |
| d179 | .. $60,000 to $69,999 | 0 | 0.00 | 0 | 0.00 | 0 | 0.00 | 0 | 0.0 |
| d180 | .. $70,000 to $79,999 | 0 | 0.00 | 0 | 0.00 | 0 | 0.00 | 0 | 0.0 |
| d181 | .. $80,000 to $89,999 | 0 | 0.00 | 0 | 0.00 | 0 | 0.00 | 0 | 0.0 |
| d182 | .. $90,000 to $99,999 | 0 | 0.00 | 11 | 6.36 | 0 | 0.00 | 11 | 1.6 |
| d183 | .. $100,000 to $124,999 | 9 | 2.75 | 14 | 8.09 | 15 | 7.69 | 38 | 5.5 |
| d184 | .. $125,000 to $149,999 | 0 | 0.00 | 32 | 18.50 | 11 | 5.64 | 43 | 6.2 |
| d185 | .. $150,000 to $174,999 | 0 | 0.00 | 21 | 12.14 | 0 | 0.00 | 21 | 3.0 |
| d186 | .. $175,000 to $199,999 | 15 | 4.59 | 0 | 0.00 | 23 | 11.79 | 38 | 5.5 |
| d187 | .. $200,000 to $249,999 | 62 | 18.96 | 25 | 14.45 | 26 | 13.33 | 113 | 16.3 |
| d188 | .. $250,000 to $299,999 | 44 | 13.46 | 0 | 0.00 | 0 | 0.00 | 44 | 6.3 |
| d189 | .. $300,000 to $399,999 | 81 | 24.77 | 27 | 15.61 | 8 | 4.10 | 116 | 16.7 |
| d190 | .. $400,000 to $499,999 | 24 | 7.34 | 31 | 17.92 | 0 | 0.00 | 55 | 7.9 |
| d191 | .. $500,000 to $749,999 | 27 | 8.26 | 12 | 6.94 | 75 | 38.46 | 114 | 16.4 |
| d192 | .. $750,000 to $999,999 | 52 | 15.90 | 0 | 0.00 | 12 | 6.15 | 64 | 9.2 |
| d193 | .. $1,000,000 or more | 13 | 3.98 | 0 | 0.00 | 25 | 12.82 | 38 | 5.5 |
| d194 | Median Housing Value (owner-occupied units) | 341,400 | ... | 217,000 | ... | 548,300 | ... | 368,900 | |
| Gross Rent (B25063) | | | | | | | | |
| d195 | Renter-Occupied Housing Units | 421 | 100.00 | 267 | 100.00 | 304 | 100.00 | 992 | 100.0 |
| d196 | With Cash Rent | 388 | 92.16 | 253 | 94.76 | 304 | 100.00 | 945 | 95.3 |
| d197 | .. Less than $100 | 0 | 0.00 | 0 | 0.00 | 0 | 0.00 | 0 | 0.0 |
| d198 | .. $100 to $149 | 0 | 0.00 | 0 | 0.00 | 0 | 0.00 | 0 | 0.0 |
| d199 | .. $150 to $199 | 12 | 2.85 | 0 | 0.00 | 0 | 0.00 | 12 | 1.2 |
| d200 | .. $200 to $249 | 0 | 0.00 | 0 | 0.00 | 0 | 0.00 | 0 | 0.0 |
| d201 | .. $250 to $299 | 0 | 0.00 | 0 | 0.00 | 0 | 0.00 | 0 | 0.0 |
| d202 | .. $300 to $349 | 0 | 0.00 | 0 | 0.00 | 0 | 0.00 | 0 | 0.0 |
| d203 | .. $350 to $399 | 0 | 0.00 | 0 | 0.00 | 0 | 0.00 | 0 | 0.0 |
| d204 | .. $400 to $449 | 0 | 0.00 | 0 | 0.00 | 0 | 0.00 | 0 | 0.0 |
| d205 | .. $450 to $499 | 0 | 0.00 | 10 | 3.75 | 0 | 0.00 | 10 | 1.0 |
| d206 | .. $500 to $549 | 0 | 0.00 | 64 | 23.97 | 0 | 0.00 | 64 | 6.5 |
| d207 | .. $550 to $599 | 110 | 26.13 | 0 | 0.00 | 44 | 14.47 | 154 | 15.5 |
| d208 | .. $600 to $649 | 39 | 9.26 | 8 | 3.00 | 8 | 2.63 | 55 | 5.5 |
| d209 | .. $650 to $699 | 27 | 6.41 | 35 | 13.11 | 9 | 2.96 | 71 | 7.2 |
| d210 | .. $700 to $749 | 112 | 26.60 | 0 | 0.00 | 21 | 6.91 | 133 | 13.4 |
| d211 | .. $750 to $799 | 9 | 2.14 | 16 | 5.99 | 31 | 10.20 | 56 | 5.6 |
| d212 | .. $800 to $899 | 15 | 3.56 | 40 | 14.98 | 88 | 28.95 | 143 | 14.4 |
| d213 | .. $900 to $999 | 0 | 0.00 | 17 | 6.37 | 36 | 11.84 | 53 | 5.3 |
| d214 | .. $1,000 to $1,249 | 27 | 6.41 | 43 | 16.10 | 10 | 3.29 | 80 | 8.1 |
| d215 | .. $1,250 to $1,499 | 26 | 6.18 | 20 | 7.49 | 7 | 2.30 | 53 | 5.3 |
| d216 | .. $1,500 to $1,999 | 0 | 0.00 | 0 | 0.00 | 0 | 0.00 | 0 | 0.0 |
| d217 | .. $2,000 or more | 11 | 2.61 | 0 | 0.00 | 50 | 16.45 | 61 | 6.1 |
| d218 | No Cash Rent | 33 | 7.84 | 14 | 5.24 | 0 | 0.00 | 47 | 4.7 |
| d219 | Median Gross Rent (renter-occupied; cash rent) | 703 | ... | 780 | ... | 844 | ... | 776 | |
Support Using these Resources
Learn more about accessing and using demographic-economic data and related analytical tools.
Join us in a Data Analytics Lab session.
There is no fee for these one-hour Web sessions.
Each informal session is focused on a specific topic.
The open structure also provides for Q&A and discussion of application issues of interest to participants.
ProximityOne User Group
Join the ProximityOne User Group
to keep up-to-date with new developments relating to metros and component geography decision-making information resources.
Receive updates and access to tools and resources available only to members.
Use this form to join the User Group.
Additional Information
ProximityOne develops geodemographic-economic data and analytical tools and helps organizations knit together and use diverse data in a decision-making and analytical framework. We develop custom demographic/economic estimates and projections, develop geographic and geocoded address files, and assist with impact and geospatial analyses.
Wide-ranging organizations use our tools (software, data, methodologies) to analyze their own data integrated with other data.
Follow ProximityOne on Twitter at www.twitter.com/proximityone.
Contact us (888-364-7656) with questions about data covered in this section or to discuss
custom estimates, projections or analyses for your areas of interest.
|