
|
|
|
.. data and tools to examine distribution and patterns .. characteristics of NORCs as census tracts based on ACS 2016 A Naturally Occurring Retirement Community (NORC) is an area that naturally evolves over time to include a relatively large concentration of households (40% or more of all households) where the householder is 65 years or older. NORCs evolve in or as neighborhoods generally on an unplanned basis. How are the more than 28 million households distributed in NORCs How are they similar or dissimilar? What special needs do the population of some NORCs have compared to others? How will the evolvement of NORCs affect our society? This section is focused on U.S. national scope analysis of the size, distribution and characteristics of NORCs. Though unplanned, NORCs will continue to evolve as habitats that require decision-making information for planning. Residents of NORCs may have requirements/needs that differ from other areas. These include transportation, social and education, assistance with household maintenance, healthcare and security. Demographics can help us assess the nature and magnitude of some of these needs and plan for improved solutions. This section uses latest available ACS 2016 data. See about ... • NORCs based on Census 2010 and block groups in this section. • NORC trends and future patterns based on projections .. more below. Naturally Occurring Retirement Communities .. householders age 65 up .. tracts with 40% or more householders age 65 up shown with blue fill pattern 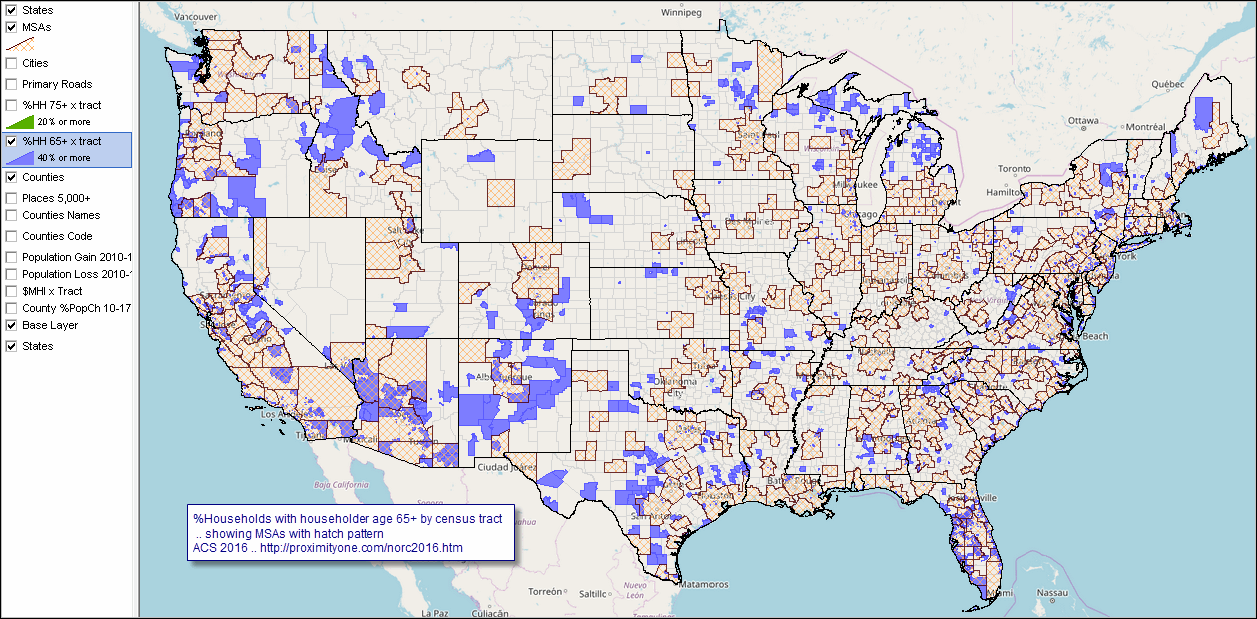 - view created with CV XE GIS software and related GIS project - click graphic for larger view showing Metropolitan Statistical Areas (MSAs) with orange hatch pattern. Examining the Scope and Distribution of NORCs Based on the ACS 2016 data at the census tract level ... • there are 117,716,237 total U.S. households • 28,245,820 households have a head of household age 65 years or over (24%) .. 2,900,512 are located in 3,742 NORCs/census tracts (total 72,836 tracts) .. where the percent of head of household age 65 or over is 40 percent or more. • Use the interactive table below to examine patterns of NORCs/census tracts. • See about limitations of the ACS-based census tract data & alternative data. • See about NORCs based on Census 2010 and block groups in this section. Naturally Occurring Retirement Communities in the Future By 2030, all baby boomers will be older than age 65. This will expand the size of the older population so that 1 in every 5 residents will be retirement age. Older people will outnumber children for the first time in U.S. history by 2035 .. there will be 78.0 million people 65 years and older compared to 76.4 million under the age of 18. By 2060, the U.S. is projected to grow by 78 million people, from about 326 million today to 404 million. As the population ages, the ratio of older adults to working-age adults, the old-age dependency ratio, is projected to rise. By 2020, there will be about three-and-a-half working-age adults for every retirement-age person. By 2060, that ratio will fall to just two-and-a-half working-age adults for every retirement-age person. The median age of the U.S. population is expected to grow from age 38 today to age 43 by 2060. Community requirements for the aging population .. we are continuing to study the size and distribution of the Naturally Occurring Retirement Communities with 5 -year projections (presently to 2023 by census tract). See more about county demographic projections to 2060 and census tract 5-year projections. Naturally Occurring Retirement Communities .. householders age 75 up .. tracts with 20% or more householders age 75 up shown with green fill pattern 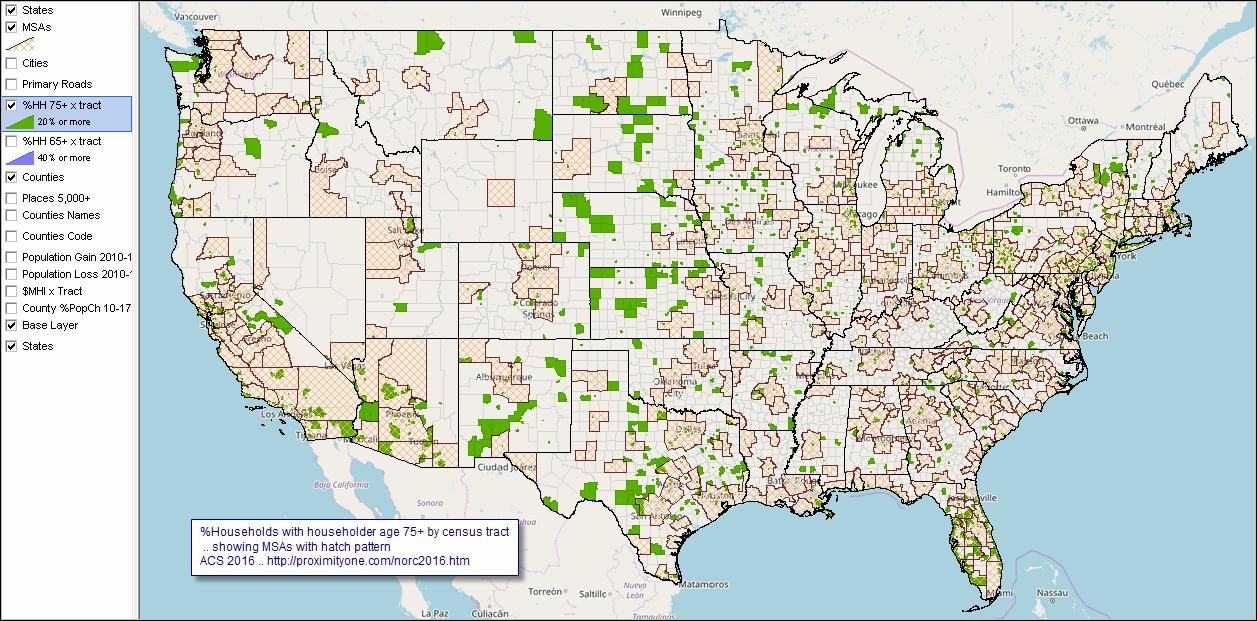 - view created with CV XE GIS software and related GIS project - click graphic for larger view showing Metropolitan Statistical Areas (MSAs) with orange hatch pattern. Households and Group Quarters This section is focused on households and household population. Progressively, much of the older population moves to groups quarters as they age -- where group quarters are available and affordable. A group quarters is a place where people live or stay, in a group living arrangement, that is owned or managed by an entity or organization providing housing and/or services for the residents. This is not a typical household-type living arrangement. These services may include custodial or medical care as well as other types of assistance, and residency is commonly restricted to those receiving these services. People living in group quarters are usually not related to each other. Group quarters include such places as college residence halls, residential treatment centers, skilled nursing facilities, group homes, military barracks, correctional facilities, and workers' dormitories. The older population often reside in GQs including nursing facilities and hospitals as patients who have no usual home elsewhere. Naturally Occurring Retirement Communities; ACS 2016 interactive table ... goto top Characteristics of census tracts (left column) based on ACS 2016 Click column header to sort; again to sort other direction. Click ShowAll button between queries to refresh. Usage notes below table. See related Interactive Tables Main Page Usage Notes • Click ShowAll between queries/filters. • Use left-most column to select by state. • Find in Name button; click ShowAll button first .. click Find in Name button to search column 1 for text in edit box. .. text entered in edit box is case sensitive. .. partial names are okay to use. Items in Table - Census Tract code -- 11 character unique code - State USPS - County Name - State + County FIPS code - CBSA code - Total Population - Educational Attainment -- percent HS Graduate - Educational Attainment -- percent College Graduate - Median Household Income - Housing Units - Households - Households with head of household age 65+ - Households with head of household age 75+ - Percent Households with head of household age 65+ - Percent Households with head of household age 75+ Defining NORCs & Data Alternatives .. goto top NORCs are defined here by using age of head of household. Analyze different percent of age of head of households using a different threshold than used here (40% of total). While this section examines age of head of household as 65 and 75 years and older, examine alternative age breaks. A more comprehensive analysis would consider people in households age 65 (some year) and over or number of people age 65 years and over per household .. or yet other attributes. As of May 2018, the most recent Census tract level population by age data from the Census Bureau are from the American Community Survey ACS 2016 5-year estimates. These estimates are centric to mid-2014, do not reflect current conditions, and are subject to statistical survey errors of estimation and other sources error. The Census Bureau does not develop population "control total" population estimates at the census tract level -- that might reflect growth or decline of population and housing units. Similarly, Census does not develop model-based population components of change nor model-based estimates of the population by age at the census tract level. Yet, the ACS data are the best national scope public use data available. Use the ProximityOne current estimates and 5-year projections for improved insights into the current NORC patterns and trends. These annual estimates are available for the period 2010 through 2023. Unlike the ACS data, these model-based estimates reflect population components of change and population single year of age change (ages 0-85 and over). See more about census tract estimates & projections. Group quarters (GQ) estimates for population in residential treatment centers, nursing facilities, group homes and other facilities as patients who have no usual home elsewhere are not available in the ACS data. GQ estimates for the population in these facilities are developed as a part of the ProximityOne tract level estimates and projections. They reflect new data on the number, size and use of these facilities. Support Using these Resources .. goto top Learn more about accessing and using demographic-economic data and related analytical tools. Join us in a Data Analytics Lab session. There is no fee for these one-hour Web sessions. Each informal session is focused on a specific topic. The open structure also provides for Q&A and discussion of application issues of interest to participants. ProximityOne User Group Join the ProximityOne User Group to keep up-to-date with new developments relating to metros and component geography decision-making information resources. Receive updates and access to tools and resources available only to members. Use this form to join the User Group. Additional Information ProximityOne develops geodemographic-economic data and analytical tools and helps organizations knit together and use diverse data in a decision-making and analytical framework. We develop custom demographic/economic estimates and projections, develop geographic and geocoded address files, and assist with impact and geospatial analyses. Wide-ranging organizations use our tools (software, data, methodologies) to analyze their own data integrated with other data. Follow ProximityOne on Twitter at www.twitter.com/proximityone. Contact us (888-364-7656) with questions about data covered in this section or to discuss custom estimates, projections or analyses for your areas of interest. |
|
|