|
|
|
-- ACS 2008-12 5-Year Estimates People with disabilities bring unique sets of skills to the workplace, enhancing the strength and diversity of the U.S. labor market. They make up a significant market of consumers, representing more than $200 billion in discretionary spending and creating technological innovation and entrepreneurship. People with disabilities also often rely on various government interventions to maintain their participation in the community. Demographic data about people with disabilities help stakeholders better understand needs and make more informed decisions relating to a wide range of topics concerning people with disabilities. New Disability Demographics Disability demographics from the American Community Survey (ACS) have been available for cities, counties and larger areas with population over 65,000 for a few years. New as of December 2013, are ACS 2012 5-year disability demographics available for all cities, school districts, counties and geographies down to the census tract level. Disability demographics are often "masked" when analyzed for larger population areas. Masked, not in the sense of suppressed data, but that concentrations that might be identified at the census tract level may become less prominent when viewed in the aggregate of county or higher level geographies. This section reviews disability-related ACS0812 data available for these small area geographies and how they can be used. Disability Concepts Subject matter categories about people with disabilities from ACS generally involve limitations with vision, hearing, cognitive, ambulatory, self-care or independent living difficulty. • Vision -- blindness or serious difficulty seeing even when wearing glasses • Hearing -- deafness or serious difficulty hearing • Cognitive -- serious difficulty concentrating, remembering or making decisions • Ambulatory -- serious difficulty walking or climbing stairs • Self-care -- difficulty bathing or dressing • Independent living -- having difficulty going outside to shop or visit a doctor's office Visual Analysis of Disability Patterns by Census Tract The following view shows the population ages 5-17 years with disabilities (ACS0812 estimates) by census tract for Harris County, Texas (Houston area). The legend at left of map shows color patterns associated with data from Table B18101 (see below). 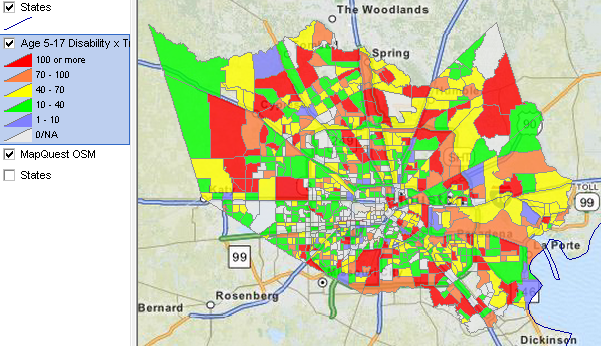 The above view was developed using the CV XE GIS software with a GIS project. The GIS project includes a county by census tract layer with Table B18101 (see below) integrated subject matter. This particular view shows patterns of the sum of items B18101007 (males age 5-17 years with disability) and B18101026 (females age 5-17 years with disability). View all items in this table by opening excel file B18101 in the scroll section below. Members of the ProximityOne User Group may download and use this project to develop similar views on their computer. Add other geographies to the view such as school districts or cities. Add your own data from any source. Join the User Group now, no fee. Disability Subject Matter Data/Tables View the scope of ACS 2012 5-year estimates subject matter using the interactive table at http://proximityone.com/acs0812.htm. Sort on the rightmost column and scroll to Disabilities. These same tables are included in the scroll box shown below. Click a link on the table number to view a sample of the data (an excel file will open). All data tables are provided for Houston ISD (HISD), Texas school district. The same scope of data are available for any school district. Table B18101 shows that there are more than 9,000 K-12 school age children with disabilities in Houston ISD (3,493 females, 6,133 males). Using the additional Table B18101 iterations, the distribution of this population can be examined by race and origin. Of course, school age children without disabilities can be impacted by other household members that do have disabilities. Demographics provided in these tables show characteristics for the total population and many age groups. Tables B18102 through B18107 provide insights into the number of persons by age and gender by type of disability. Table B18135 provides data on health insurance coverage. Employment status and workforce data are provided by Tables C18120 and C18121. Earnings and poverty characteristics data are provided by Tables B18140, C18130 and C18131. Scroll section ...
B18101 SEX BY AGE BY DISABILITY STATUS
... Civilian noninstitutionalized population B18101A AGE BY DISABILITY STATUS (WHITE ALONE) ... White alone civilian noninstitutionalized population B18101B AGE BY DISABILITY STATUS (BLACK OR AFRICAN AMERICAN ALONE) ... Black or African American alone civilian noninstitutionalized population B18101C AGE BY DISABILITY STATUS (AMERICAN INDIAN AND ALASKA NATIVE ALONE) ... American Indian and Alaska Native alone civilian noninstitutionalized population B18101D AGE BY DISABILITY STATUS (ASIAN ALONE) ... Asian alone civilian noninstitutionalized population B18101E AGE BY DISABILITY STATUS (NATIVE HAWAIIAN AND OTHER PACIFIC ISLANDER ALONE) ... Native Hawaiian and other Pacific Islander alone civilian noninstitutionalized population B18101F AGE BY DISABILITY STATUS (SOME OTHER RACE ALONE) ... Some other race alone civilian noninstitutionalized population B18101G AGE BY DISABILITY STATUS (TWO OR MORE RACES) ... Two or more races civilian noninstitutionalized population B18101H AGE BY DISABILITY STATUS (WHITE ALONE, NOT HISPANIC OR LATINO) ... White alone, not Hispanic or Latino civilian noninstitutionalized population B18101I AGE BY DISABILITY STATUS (HISPANIC OR LATINO) ... Hispanic or Latino civilian noninstitutionalized population B18102 SEX BY AGE BY HEARING DIFFICULTY ... Civilian noninstitutionalized population B18103 SEX BY AGE BY VISION DIFFICULTY ... Civilian noninstitutionalized population B18104 SEX BY AGE BY COGNITIVE DIFFICULTY ... Civilian noninstitutionalized population 5 years and over B18105 SEX BY AGE BY AMBULATORY DIFFICULTY ... Civilian noninstitutionalized population 5 years and over B18106 SEX BY AGE BY SELF-CARE DIFFICULTY ... Civilian noninstitutionalized population 5 years and over B18107 SEX BY AGE BY INDEPENDENT LIVING DIFFICULTY ... Civilian noninstitutionalized population 18 years and over B18135 AGE BY DISABILITY STATUS BY HEALTH INSURANCE COVERAGE STATUS ... Civilian Noninstitutionalized Population B18140 MEDIAN EARNINGS IN THE PAST 12 MONTHS ... Civilian Noninstitutionalized Population 16 Years and Over with Earnings in the Past 12 Months C18108 AGE BY NUMBER OF DISABILITIES ... Civilian noninstitutionalized population C18120 EMPLOYMENT STATUS BY DISABILITY STATUS ... Civilian noninstitutionalized population 18 to 64 years C18121 WORK EXPERIENCE BY DISABILITY STATUS ... Civilian Noninstitutionalized Population 18 to 64 years C18130 AGE BY DISABILITY STATUS BY POVERTY STATUS ... Civilian noninstitutionalized population for whom poverty status is determined C18131 RATIO OF INCOME TO POVERTY LEVEL IN THE PAST 12 MONTHS BY DISABILITY STATUS ... Civilian Noninstitutionalized Population for Whom Poverty Status is Determined Accessing & Using the Data Access the above tables using the CV APIGateway. Integrate the disability-related data with other demographic-economic data from ACS 2012 and other data sources. Save data for multi-geography such as all census tracts for a county. Merge these data into a county by tract shapefile and use the CV XE GIS software to visually examine small area patterns of the population with disabilities. Additional Information ProximityOne develops geographic-demographic-economic data and analytical tools and helps organizations knit together and use diverse data in a decision-making and analytical framework. We develop custom demographic/economic estimates and projections, develop geographic and geocoded address files, and assist with impact and geospatial analyses. Wide-ranging organizations use our tools (software, data, methodologies) to analyze their own data integrated with other data. Follow ProximityOne on Twitter at www.twitter.com/proximityone. Contact us (888-364-7656) with questions about data covered in this section or to discuss custom estimates, projections or analyses for your areas of interest. |
|
|