|
|
|
Examining Workforce Characteristics and Patterns -- using the ACS EEO 2010 special tabulation The American Community Survey (ACS) 2010 Equal Employment Opportunity (EEO) Workforce special tabulation offers unique insights into industry-occupation characteristics and related labor force attributes. These data are based on the ACS 2010 5-year respondent data. The EEO/workforce special tabulation serves as the primary external benchmark for comparing the race, ethnicity, and sex composition of an organization's internal workforce, and the analogous external labor market, within a specified geography and job category. This section provides an overview of the ACS 2010 EEO special tabulation. See links at upper left to view related sections. Use ProximityOne tools to access and use EEO/workforce data. Knit together the EEO/workforce data with organization and establishment employment data to meet reporting and analytical needs. Analyze demographic characteristics by place of work and place of residence. Integrate data from the full American Community Survey annual updates with drill-down to the block group geographic level and Census 2010 to the census block level through use APIs. Create thematic maps showing patterns and perform related geospatial analyses. Scope of Subject Matter and Geography ... scroll section
Subject Matter. The scope of subject matter is similar to the 2000 EEO Special Tabulation.
Some tables include the additional characteristic of U.S. citizenship.
All tables include margins of error for all estimates.
Occupation categories are based on the 2010 Standard Occupational Classification (SOC)
system.
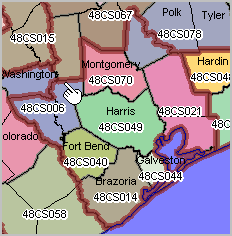
Characteristics include sex, race and Hispanic origin, crosstabulated by a combination of other characteristics including citizenship, occupation, industry, age, educational attainment, earnings. Geography. Data are tabulated by worksite, residence-to-worksite commuting flow and residence. Data are tabulated in tables for these geographic summary levels U.S. (010), states and D.C. (040), metros/Core Based Statistical Areas (CBSAs) (310), counties (050), cities/places (160), and county sets (county sets with populations of 50,000 or more/non CBSAs) (902). Population thresholds apply to all summary levels except U.S. & States. Population thresholds are either 50,000 or 100,000, depending on specific table content, and are based on residence population. EEO/Workforce County-County Sets Interactive Table Click column header to sort; again to sort other direction. Usage notes below table. See related Interactive Tables Ranking Table Usage Notes Use the vertical scrollbar at far right in table to scroll across (up/down) rows. Optionally sort on selected column or view only districts in one state then sort ... • Click on column header to sort on that column; click column header again to sort in other direction. • Click ShowAll button to show all areas and restore full set of data view. • Click State to view counties in a selected state (click ShowAll between selections). • Find by County Name: key in partial area name in text box to right of Find-in-County-Name button then click button to locate all matches (case sensitive). • See related ranking tables. Support Using these Resources Learn more about accessing and using demographic-economic data and related analytical tools. Join us in a Data Analytics Lab session. There is no fee for these one-hour Web sessions. Each informal session is focused on a specific topic. The open structure also provides for Q&A and discussion of application issues of interest to participants. ProximityOne User Group Join the ProximityOne User Group to keep up-to-date with new developments relating to metros and component geography decision-making information resources. Receive updates and access to tools and resources available only to members. Use this form to join the User Group. Additional Information ProximityOne develops geodemographic-economic data and analytical tools and helps organizations knit together and use diverse data in a decision-making and analytical framework. We develop custom demographic/economic estimates and projections, develop geographic and geocoded address files, and assist with impact and geospatial analyses. Wide-ranging organizations use our tools (software, data, methodologies) to analyze their own data integrated with other data. Follow ProximityOne on Twitter at www.twitter.com/proximityone. Contact us (888-364-7656) with questions about data covered in this section or to discuss custom estimates, projections or analyses for your areas of interest. |
|
|