
|
|
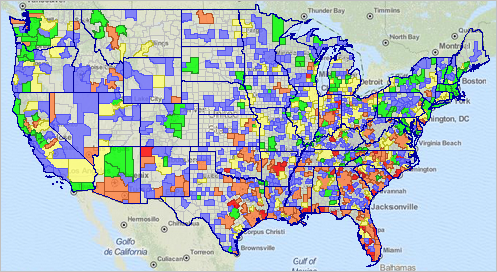
This section is focused on American Community Survey (ACS) 2012 data access and use, applications using these data and the integration and analysis of these data with other data. Census 2010 and ACS 2012 provide the most current Census-sourced demographics for wide-ranging geography. Use the interactive table below to view/rank/query/compare selected Census 2010 demographics with ACS 2012 1-year estimates for selected national scope geography. Data access options: • Interactive tables with selected characteristics: - 989 Largest School Districts - 521 Largest Metropolitan Areas (all MSAs) - 561 Largest Cities/Places - 415 Largest Urbanized Areas - all 113th Congressional Districts • APIGateway access to ACS 2012 demographic-economic profiles for most types of areas • APIGateway augmentation of county integrated multi-sourced profiles: - linking ACS 2012 data with other data -- Harris County, TX example ProximityOne integrates Census 2010 and ACS data with other data to develop current estimates and projections. Access and analyze these data using the Web/online Demographic-Economic Statistical System, and CV XE GIS. News & Updates -- scroll section
07.30.14. Finding Your Data
... http://proximityone.com/finding_your_data.htm ... locating ACS subject matter ... review of methods & resources to locate specific subject matter ... tools you can use for query & search 07.28.14. ProximityOne Data Services Program ... http://proximityone.com/pds.htm ... linking ACS data with related data resources ... coordinated suite of downloadable datasets ... supported with API data extraction tools 05.16.14. Rental Market Conditions by State & Metropolitan Area; 2014 Update ... http://proximityone.com/metro_rentalmarket_2014.htm ... U.S., states and metros -- interactive housing market characteristics table  Interactive Ranking Tables -- scroll section
U.S.-State-Metro -- http://proximityone.com/metros.htm
- General Demographics -- http://proximityone.com/usstcbsa12dp1.htm - Social Characteristics -- http://proximityone.com/usstcbsa12dp2.htm - Economic Characteristics -- http://proximityone.com/usstcbsa12dp3.htm - Housing Characteristics -- http://proximityone.com/usstcbsa12dp4.htm U.S.-State-113th Congressional Districts -- http://proximityone.com/cd113.htm - General Demographics -- http://proximityone.com/cd11312dp1.htm - Social Characteristics -- http://proximityone.com/cd11312dp2.htm - Economic Characteristics -- http://proximityone.com/cd11312dp3.htm - Housing Characteristics -- http://proximityone.com/cd11312dp4.htm Public Use Microdata Areas -- http://proximityone.com/puma2010.htm - General Demographics -- http://proximityone.com/puma12dp1.htm - Social Characteristics -- http://proximityone.com/puma12dp2.htm - Economic Characteristics -- http://proximityone.com/puma12dp3.htm - Housing Characteristics -- http://proximityone.com/puma12dp4.htm Merged Geographics 2012 ... based on ACS 2012 1-year data - General Demographics -- http://proximityone.com/acs2012_usdp5.htm - Social Characteristics -- http://proximityone.com/acs2012_usdp2.htm - Economic Characteristics -- http://proximityone.com/acs2012_usdp3.htm - Housing Characteristics -- http://proximityone.com/acs2012_usdp4.htm ACS 2012 Data Release Dates ACS 2012 1-year data (areas 65,000 population & over) - 1-year summary statistic estimates (Sept. 19, 2013) . Technical Documentation . Table Shells (xls) . Sequence/Table Number Lookup (xls) - 1-year Public Use Microdata Area summary statistic data (Oct. 24, 2013) . 2,378 contiguous areas covering the U.S. wall to wall conforming to state and mostly tract boundaries - 1-year PUMS files (Dec. 17, 2013) ACS 2012 1-Year PUMS Main Page ACS 2012 3-year data (areas 20,000 population & over) - 3-year summary statistic estimates (Nov. 14, 2013) - 3-year PUMS files (Feb. 6, 2014) ACS 2012 5-year data areas -- all areas including all block groups (Dec. 17, 2013) ACS 2012 5-Year Estimates Main Page - 5-year PUMS files (Mar. 6, 2014) ACS 2012 SDST - 5-year estimates, School District Special Tabulation (May 2014) ACS 2012 Geography Census tracts; block groups; -- Census 2010 Core-Based Statistical Areas (CBSAs); Metros -- OMB Feb 2013 vintage Congressional District -- 113th Congress Cities/places -- January 2013 School Districts -- 2011-12 Urban Areas -- Census 2010 (ACS 2011 was Census 2000) Public Use Microdata Areas -- Census 2010 (ACS 2011 was Census 2000) Examine ACS 2012 Demographic-Economic Profiles for Selected Areas ... We will develop ACS 2012 "richer demographic-economic" profiles for all school districts, metros, congressional districts, counties, cities/places and selected other types of areas similar to those that may be accessed below based on ACS 2010 5-year estimates. Projections to 2018 are optionally available. The ACS 2012 1-year profiles will be available in September 2013; ACS 2012 5-year profiles will be available in December 2013; School districts reflect 2011-12 boundaries, congressional districts the 113th Congress, other areas reflect boundaries as of January 2013. These data tell us about area characteristics including educational attainment, enrollment by type of educational institution/level, workforce and employment, age and gender, place of birth, citizenship status, ancestry, foreign born population, language spoken at home, income and poverty, race/ethnicity, household composition and family structure, housing value and rent, mobility, vehicles, commuting, housing stock and attributes, among others. Click a state link to view ACS 2010-based profiles, and related information, for school districts ... About ACS. The American Community Survey (ACS) is a nationwide survey conducted by the Census Bureau designed to provide more frequently updated demographics for national and sub-national geography than provided by the decennial census program. The ACS collects and produces population and housing information every year instead of every ten years The ACS currently has an annual sample size of about 3.5 million addresses. ACS is integrally connected with Census 2010. ProximityOne User Group Join the ProximityOne User Group to keep up-to-date with new developments relating to geographic-demographic-economic decision-making information resources. Receive updates and access to tools and resources available only to members. Use this form to join the User Group. There is no fee. Support Using these Resources Learn more about accessing, integrating and using ACS data. Join us in a Decision-Making Information Web session. There is no fee for these one-hour Web sessions. Each informal session is focused on a specific topic. The open structure also provides for Q&A and discussion of application issues of interest to participants. Additional Information ProximityOne develops geographic-demographic-economic data and analytical tools and helps organizations knit together and use diverse data in a decision-making and analytical framework. We develop custom demographic/economic estimates and projections, develop geographic and geocoded address files, and assist with impact and geospatial analyses. Wide-ranging organizations use our tools (software, data, methodologies) to analyze their own data integrated with other data. Follow ProximityOne on Twitter at www.twitter.com/proximityone. Contact us (888-364-7656) with questions about data covered in this section or to discuss custom estimates, projections or analyses for your areas of interest. |
|
|