|
|
Census Tracts Main |
Citizen Voting Age Population Demographics
click graphic for info; hover to pause Examining Neighborhood Change
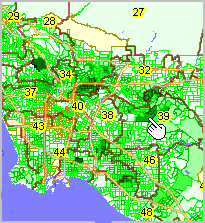
in relation to voting districts & Congressional Districts This section provides information and tools to examine demographic characteristics of citizen voting age population (CVAP) by census tract/neighborhood in context of voting districts and congressional districts. Use the interactive ranking table to view/rank/compare/query national scope CVAP estimates by race/ethnicity by census tract. Most data in this section are based on the 2011 American Community Survey (ACS) 2007-2011 5-year CVAP special tabulation. Additional items are included from Census 2010 and ACS 2011 5-year estimates. More about census tracts. More about uses of the CVAP data. Geography CVAP estimates have been developed for U.S. national scope geographic areas including the U.S., state, county, city/place, minor civil division, census tract and block group. Subject Matter The scope of the subject matter is focused on total number of United States citizens for the geographic area total number of United States citizens 18 years of age or older for the geographic area, each cross-classified by several race/ethnicity groups. The estimates for the number of citizens and voting age population for each of the race/ethnicity groups is shown in the ranking table. A list of the items/columns is presented below the table. Thematic Maps & Visual Pattern Analysis Use CVXE GIS and the CVAP GIS Project files to examining small area citizen voting age population characteristics in context of 113th Congressional Districts, state legislative districts and voting districts. Gain insights not possible using tabular data alone. The map graphic at the right shows patterns of percent Asian citizen voting age population by census tract in the Los Angeles area. 113th Congressional Districts shown with brown boundaries; interstate highways shown for orientation. Green patterns show different percentage intervals of percent Asian citizen voting age population by census tract. See larger map with more details. Census Tract Citizen Voting Age Population: ACS 2007-2011 -- Interactive Ranking Table See related Ranking Tables Main Page Usage: click column header to sort; click again to sort other direction. Column Headers; Subject Matter Items All special tabulation estimates are based on survey respondent data collected 2007-2011 and are centric to mid-2009. geoid -- Census 2010 census tract code SS-CCC-TTTTTT state -- state postal abbreviation p_cen2010 -- Census 2010 total population (not from special tab) p_acs0711 -- ACS 2011 5-year total population estimate (not from special tab) c_total - citizens - total population v_total - voting age citizens - total population c_nhisp - citizens - Not Hispanic or Latino (NH) v_nhisp - voting age citizens - Not Hispanic or Latino (NH) c_aian - citizens - American Indian or Alaska Native Alone (NH) v_aian - voting age citizens - American Indian or Alaska Native Alone (NH) c_asian - citizens - Asian Alone (NH) v_asian - voting age citizens - Asian Alone (NH) c_black - citizens - Black or African American Alone (NH) v_black - voting age citizens - Black or African American Alone (NH) c_nhpi - citizens - Native Hawaiian or Other Pacific Islander Alone (NH) v_nhpi - voting age citizens - Native Hawaiian or Other Pacific Islander Alone (NH) c_white - citizens - White Alone (NH) v_white - voting age citizens - White Alone (NH) c_aian_w - citizens - American Indian or Alaska Native and White (NH) v_aian_w - voting age citizens - American Indian or Alaska Native and White (NH) c_asian_w - citizens - Asian and White (NH) v_asian_w - voting age citizens - Asian and White (NH) c_black_w - citizens - Black or African American and White (NH) v_black_w - voting age citizens - Black or African American and White (NH) c_aian_b - citizens - American Indian or Alaska Native and Black or African American (NH) v_aian_b - voting age citizens - American Indian or Alaska Native and Black or African American (NH) c_tomr_o - citizens - Remainder of Two or More Race Responses (NH) v_tomr_o - voting age citizens - Remainder of Two or More Race Responses (NH) c_hispanic - citizens - Hispanic or Latino v_hispanic - voting age citizens - Hispanic or Latino Table Usage Notes • Click on a column header to sort on that column; click column header again to sort in other direction. • Click ShowAll button to show all areas and restore full set of data view. • Click State to select all areas in a selected state (click ShowAll between selections). • View additional rows/areas by sliding vertical scrollbar at table right. • Modify column width by dragging column separator in header row. • View additional columns by sliding horizontal scrollbar (leftmost columns remain fixed). About Census Tract Geography and Codes Census tracts are defined by the Census Bureau and organized as sub-county building blocks. Census tracts are small geographic areas, designed to average 4,000 population, but vary widely. Census tracts cover the U.S. wall-to-wall provide a good geographic granularity to meet many needs. Unchanging throughout the decade, census tract boundaries are subject to update for each decennial census. Major changes occurred with Census 2010 vintage census tracts as the approximate 65,000 Census 2000 census tracts expanded to 73,057 Census 2010 census tracts. Census tracts were first designed to be relatively homogeneous with respect to population characteristics, economic status, and living conditions. Over time, with demographic shifts, census tracts are often no longer so homogenous. However, tracts do closely approximate neighborhoods/neighborhood parts for many areas. The geographic size of census tracts varies widely depending on the density of settlement. Census tract boundaries are delineated with the intention of being maintained over many decades so that statistical comparisons can be made from decennial census to decennial census. Census tracts may be split due to population growth or combined as a result of substantial population decline. Census tracts were initially identified by a four-digit basic number and with a two-digit numeric suffix; for example, 6059.02. This version of the tract code is shown in column 3 in the ranking table. The decimal point separating the four-digit basic tract number from the two-digit suffix has been historically shown in printed reports and maps. Many census tracts do not have a suffix; in such cases, the suffix field is either left blank or is zero-filled. Census tract suffixes may range from .01 to .98. These optionally ways of assigning census tract geocodes or handles has led to some vagueness potentially creating problems in handling now common spreadsheet or CSV files. The national scope uniquely identifying tract geocode is the 11 character code shown in column 4 in the ranking table. The tract geocode is of the form SSCCCTTTTTT where SS is the FIPS state code, CCC is the county FIPS code and TTTTTT is the Census assigned tract code. In the tract geocode, there are never blanks or dots and lead zeroes are used for each the state, county and tract code components. This is the recommended tract unique identifier. Uses of the CVAP Data The Voting Rights Act prohibits development of voting districts that discriminate against potential voters on the basis of race and/or language minority status. To examine how voting districts comply with the Voting Rights Act requires data on the citizen voting age population (CVAP) by race/origin for small geographic areas. The ACS 2011 5-year CVAP special tabulation provides these estimates for census tracts and block groups. The CVAP estimates provide only one part of the required data. The voting district boundaries are also needed to be used in combination with the CVAP estimates. Using GIS tools, the CVAP estimates can be used in mapping applications, such as those reviewed in this section, in combination with voting district boundaries to reveal potential non-compliance in the structure of voting districts. Additional Information ProximityOne develops geographic-demographic-economic data and analytical tools and helps organizations knit together and use diverse data in a decision-making and analytical framework. We develop custom demographic/economic estimates and projections, develop geographic and geocoded address files, and assist with impact and geospatial analyses. Wide-ranging organizations use our tools (software, data, methodologies) to analyze their own data integrated with other data. Contact ProximityOne (888-364-7656) with questions about data covered in this section or to discuss custom estimates, projections or analyses for your areas of interest. |
|
|