Congressional
Districts Main
Related Sections
Situation & Outlook
CVXE GIS Tools
Data Resources Guide
- projections to 2060
- Applications Gallery
- States
- School Districts
- Counties
- Cities/Places
- Tracts/Neighborhoods
- Block Groups
- Census Blocks
- ZIP Codes
- Urban Areas
Demographic-Economic
Estimates-Projections
GIS Thematic Mapping
Visual Analysis Tools
Ranking Tables
National Scope
Demographic Change
2000-2010
- States
- Metros
- Congressional District
- School Districts
- Counties
- Cities/Places
- Census Tracts
|
|
Congressional District Demographic-Economic Characteristics
... resources to assess the state of economy, social patterns, education and special interests
Decision-Making Information

|
ProximityOne
information resources & solutions
(888) DMI-SOLN
(888) 364-7656
Visual analysis with ProximityOne tools
click graphic for info; hover to pause
Decision-Making Information Blog
Power of Combining Maps with Data
Support & Technical Assistance
help using these resources
|
This section provides an example of the extended demographic-economic profiles
available for 113th/114th Congressional Districts.
Boundaries for the 113th and 114th Congressional Districts are the same.
This example provides four illustrative profiles for the New York 12th
Congressional District. View the approximate 600 subject matter items in the scroll boxes below.
These data/profiles are available for any congressional district.
The data are based on the
American Community Survey 1-year estimates.
The profiles have been developed using the ProximityOne
S&O Server. The
S&O Server enables development of structured profiles like those shown here using API calls to multi-sourced
data. Data may be combined in one display grid for multiple types of geography and sourced from multiple
statistical programs and viewed and/or output to alternative file structures.
In addition to individual district profiles in HTML or Excel, the data are also available
structured as four CSV/Excel datasets for national scope analysis.
Contact us
for additional information (mention CD DP Profiles).
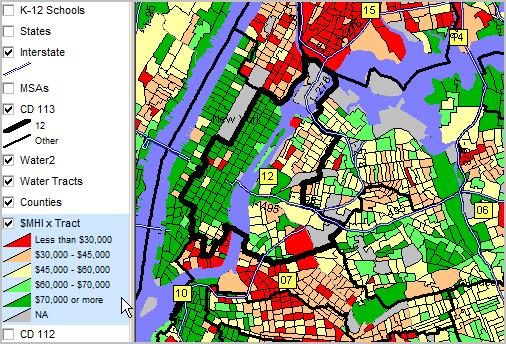
New York 12th Congressional District
The thematic map shown below depicts patterns of economic prosperity (median household income) by neighborhood/census tract
for the New York 12th Congressional District (bold black boundary).
See this type of map view for any Congressional District in the CDGallery at
http://proximityone.com/cdgallery/guide.
Use the four scroll boxes below to view detailed demographic-economic characteristics of this district.
Numbers/references shown to the left of data items descriptions (e.g. D001) are short-hand tags
used to reference respective items in datasets. The profile display may optional show or conceal this
tag.
General Demographics
DP1 General Demographics
| New York Congressional District 12 | | |
| DP1 - General Demographics | Number | Percent |
| AGE AND GENDER | | |
| D001 Total population | 708,096 | 100.00 |
| D002 .. Male | 331,930 | 46.88 |
| D003 .. Female | 376,166 | 53.12 |
| D004 .. Under 5 years | 29,147 | 4.12 |
| D005 .. 5 to 9 years | 22,370 | 3.16 |
| D006 .. 10 to 14 years | 19,483 | 2.75 |
| D007 .. 15 to 19 years | 25,681 | 3.63 |
| D008 .. 20 to 24 years | 57,614 | 8.14 |
| D009 .. 25 to 34 years | 183,308 | 25.89 |
| D010 .. 35 to 44 years | 109,230 | 15.43 |
| D011 .. 45 to 54 years | 83,773 | 11.83 |
| D012 .. 55 to 59 years | 39,895 | 5.63 |
| D013 .. 60 to 64 years | 37,014 | 5.23 |
| D014 .. 65 to 74 years | 54,392 | 7.68 |
| D015 .. 75 to 84 years | 33,471 | 4.73 |
| D016 .. 85 years and over | 12,718 | 1.80 |
| D017 Median age (years) | 36.3 | |
| D018 .. 18 years and over | 626,023 | 88.41 |
| D019 .. 21 years and over | 603,006 | 85.16 |
| D020 .. 62 years and over | 122,091 | 17.24 |
| D021 .. 65 years and over | 100,581 | 14.20 |
| D022 .. 18 years and over | 626,023 | 88.41 |
| D023 .... Male | 291,694 | 41.19 |
| D024 .... Female | 334,329 | 47.22 |
| D025 .. 65 years and over | 100,581 | 14.20 |
| D026 .... Male | 43,062 | 6.08 |
| D027 .... Female | 57,519 | 8.12 |
| RACE | | |
| D028 Total population | 708,096 | 100.00 |
| D029 .. One race | 690,730 | 97.55 |
| D030 .. Two or more races | 17,366 | 2.45 |
| D031 .. One race | 690,730 | 97.55 |
| D032 .... White | 537,015 | 75.84 |
| D033 .... Black or African American | 34,384 | 4.86 |
| D034 .... American Indian and Alaska Native | 2,248 | 0.32 |
| D035 ...... Cherokee tribal grouping | 0 |
| D036 ...... Chippewa tribal grouping | 0 |
| D037 ...... Navajo tribal grouping | 0 |
| D038 ...... Sioux tribal grouping | 0 |
| D039 .... Asian | 81,947 | 11.57 |
| D040 ...... Asian Indian | 17,313 | 2.45 |
| D041 ...... Chinese | 29,430 | 4.16 |
| D042 ...... Filipino | 4,546 | 0.64 |
| D043 ...... Japanese | 7,660 | 1.08 |
| D044 ...... Korean | 11,156 | 1.58 |
| D045 ...... Vietnamese | 1,688 | 0.24 |
| D046 ...... Other Asian | 10,154 | 1.43 |
| D047 .... Native Hawaiian and Other Pacific Islander | 192 | 0.03 |
| D048 ...... Native Hawaiian | 0 |
| D049 ...... Guamanian or Chamorro | 0 |
| D050 ...... Samoan | 0 |
| D051 ...... Other Pacific Islander | 0 |
| D052 .... Some other race | 34,944 | 4.93 |
| D053 .. Two or more races | 17,366 | 2.45 |
| D054 .... White and Black or African American | 2,282 | 0.32 |
| D055 .... White and American Indian and Alaska Native | 1,474 | 0.21 |
| D056 .... White and Asian | 8,421 | 1.19 |
| D057 .... Black and American Indian and Alaska Native | 224 | 0.03 |
| Race alone or in combination with one or more other race | | |
| D058 Total population | 708,096 | 100.00 |
| D059 .. White | 552,382 | 78.01 |
| D060 .. Black or African American | 38,251 | 5.40 |
| D061 .. American Indian and Alaska Native | 4,899 | 0.69 |
| D062 .. Asian | 92,073 | 13.00 |
| D063 .. Native Hawaiian and Other Pacific Islander | 964 | 0.14 |
| D064 .. Some other race | 38,147 | 5.39 |
| HISPANIC OR LATINO AND RACE | | |
| D065 Total population | 708,096 | 100.00 |
| D066 .. Hispanic or Latino (of any race) | 98,223 | 13.87 |
| D067 .... Mexican | 18,326 | 2.59 |
| D068 .... Puerto Rican | 26,145 | 3.69 |
| D069 .... Cuban | 3,455 | 0.49 |
| D070 .... Other Hispanic or Latino | 50,297 | 7.10 |
| D071 .. Not Hispanic or Latino | 609,873 | 86.13 |
| D072 .... White alone | 479,772 | 67.76 |
| D073 .... Black or African American alone | 30,989 | 4.38 |
| D074 .... American Indian and Alaska Native alone | 748 | 0.11 |
| D075 .... Asian alone | 81,808 | 11.55 |
| D076 .... Native Hawaiian and Other Pacific Islander alone | 192 | 0.03 |
| D077 .... Some other race alone | 2,878 | 0.41 |
| D078 .... Two or more races | 13,486 | 1.90 |
| D079 .... Two races including Some other race | 890 | 0.13 |
| D080 ...... Two races excluding Some other race, and Thre | 12,596 | 1.78 |
| D081 Total housing units | 425,426 | |
Based on data from Census 2010 and American Community Survey
Developed using ProximityOne S&O Server -- http://proximityone.com/s&o/guide/server.htm
Social Characteristics
DP2 Social Characteristics
| New York Congressional District 12 | | |
| DP2 - Social Characteristics | Number | Percent |
| HOUSEHOLDS BY TYPE | | |
| S001 Total households | 359,499 | 100.00 |
| S002 .. Family households (families) | 128,135 | 35.64 |
| S003 .... With own children under 18 years | 46,455 | 12.92 |
| S004 .... Married-couple family | 96,671 | 26.89 |
| S005 ...... With own children under 18 years | 33,792 | 9.40 |
| S006 .... Male householder, no wife present, family | 8,109 | 2.26 |
| S007 ...... With own children under 18 years | 1,940 | 0.54 |
| S008 .... Female householder, no husband present, family | 23,355 | 6.50 |
| S009 ...... With own children under 18 years | 10,723 | 2.98 |
| S010 .. Nonfamily households | 231,364 | 64.36 |
| S011 .... Householder living alone | 178,128 | 49.55 |
| S012 ...... 65 years and over | 43,401 | 12.07 |
| S013 .. Households with 1 or more people under 18 years | 48,533 | 13.50 |
| S014 .. Households with 1 or more people 65 years & over | 76,601 | 21.31 |
| S015 Average household size | 1.90 | |
| S016 Average family size | 2.81 | |
| RELATIONSHIP | | |
| S017 Population in households | 682,522 | 100.00 |
| S018 .. Householder | 359,499 | 52.67 |
| S019 .. Spouse | 96,838 | 14.19 |
| S020 .. Child | 106,888 | 15.66 |
| S021 .. Other relatives | 27,911 | 4.09 |
| S022 .. Nonrelatives | 91,386 | 13.39 |
| S023 .. Unmarried partner | 25,440 | 3.73 |
| MARITAL STATUS | | |
| S024 Males 15 years and over | 296,271 | 100.00 |
| S025 .. Never married | 154,828 | 52.26 |
| S026 .. Now married, except separated | 112,289 | 37.90 |
| S027 .. Separated | 4,926 | 1.66 |
| S028 .. Widowed | 5,133 | 1.73 |
| S029 .. Divorced | 19,095 | 6.45 |
| S030 Females 15 years and over | 340,825 | 100.00 |
| S031 .. Never married | 173,810 | 51.00 |
| S032 .. Now married, except separated | 105,921 | 31.08 |
| S033 .. Separated | 5,107 | 1.50 |
| S034 .. Widowed | 22,706 | 6.66 |
| S035 .. Divorced | 33,281 | 9.76 |
| FERTILITY | | |
| S036 Number of women 15 to 50 years old who had a birth | 6,151 | 100.00 |
| S037 Unmarried women: widowed, divorced, never married | 1,376 | 22.37 |
| S038 .. Per 1,000 unmarried women | 9 | |
| S039 .. Per 1,000 women 15 to 50 years old | 27 | |
| S040 .... Per 1,000 women 15 to 19 years old | 10 | |
| S041 .... Per 1,000 women 20 to 34 years old | 19 | |
| S042 .... Per 1,000 women 35 to 50 years old | 44 | |
| GRANDPARENTS | | |
| S043 Number of grandparents living with own grandchild | 4,545 | 100.00 |
| S044 .. Responsible for grandchildren | 1,188 | 26.14 |
| Years responsible for grandchildren | | |
| S045 .... Less than 1 year | 479 | |
| S046 .... 1 or 2 years | 343 | |
| S047 .... 3 or 4 years | 92 | |
| S048 .... 5 or more years | 274 | |
| S049 Grandparents responsible for own grandchldren | 1,188 | 100.00 |
| S050 .. Who are female | 961 | 80.89 |
| S051 .. Who are married | 408 | 34.34 |
| SCHOOL ENROLLMENT | | |
| S052 Population 3 years and over enrolled in school | 131,116 | 100.00 |
| S053 .. Nursery school, preschool | 8,121 | 6.19 |
| S054 .. Kindergarten | 5,366 | 4.09 |
| S055 .. Elementary school (grades 1-8) | 33,893 | 25.85 |
| S056 .. High school (grades 9-12) | 15,317 | 11.68 |
| S057 .. College or graduate school | 68,419 | 52.18 |
| EDUCATIONAL ATTAINMENT | | |
| S058 Population 25 years and over | 553,801 | 100.00 |
| S059 .. Less than 9th grade | 21,067 | 3.80 |
| S060 .. 9th to 12th grade, no diploma | 21,798 | 3.94 |
| S061 .. High school graduate (includes equivalency) | 56,673 | 10.23 |
| S062 .. Some college, no degree | 57,655 | 10.41 |
| S063 .. Associate's degree | 16,963 | 3.06 |
| S064 .. Bachelor's degree | 209,214 | 37.78 |
| S065 .. Graduate or professional degree | 170,431 | 30.77 |
| S066 Percent high school graduate or higher | 92.3 | |
| S067 Percent bachelor's degree or higher | 68.6 | |
| VETERAN STATUS | | |
| S068 Civilian population 18 years and over | 625,755 | 100.00 |
| S069 .. Civilian veterans | 21,250 | 3.40 |
| Disability Status; Civilian Noninstitutionalized Population | | |
| S070 Total Civilian Noninstitutionalized Population | 702,663 | 100.00 |
| S071 .. With a disability | 56,031 | 7.97 |
| S072 .. Under 18 years | 81,811 | 11.64 |
| S073 .... With a disability | 1,569 | 0.22 |
| S074 .. 18 to 64 years | 522,612 | 74.38 |
| S075 .... With a disability | 27,195 | 3.87 |
| S076 .. 65 years and over | 98,240 | 13.98 |
| S077 .... With a disability | 27,267 | 3.88 |
| RESIDENCE 1 YEAR AGO | | |
| S078 Population 1 year and over | 702,835 | 100.00 |
| S079 .. Same house | 573,422 | 81.59 |
| S080 .. Different house in the U.S. | 112,392 | 15.99 |
| S081 .... Same county | 55,854 | 7.95 |
| S082 .... Different county | 56,538 | 8.04 |
| S083 ...... Same state | 25,580 | 3.64 |
| S084 ...... Different state | 30,958 | 4.40 |
| S085 Abroad | 17,021 | 2.42 |
| PLACE OF BIRTH | | |
| S086 Total population | 708,096 | 100.00 |
| S087 .. Native | 522,798 | 73.83 |
| S088 .... Born in United States | 500,572 | 70.69 |
| S089 ...... State of residence | 292,776 | 41.35 |
| S090 ...... Different state | 207,796 | 29.35 |
| S091 .... Born in PR, US Island areas, abroad US citizen | 22,226 | 3.14 |
| S092 .. Foreign born | 185,298 | 26.17 |
| U.S. CITIZENSHIP STATUS | | |
| S093 Foreign-born population | 185,298 | 100.00 |
| S094 .. Naturalized U.S. citizen | 84,390 | 45.54 |
| S095 .. Not a U.S. citizen | 100,908 | 54.46 |
| YEAR OF ENTRY | | |
| S096 Population born outside the United States | 207,524 | 100.00 |
| S097 .. Native | 22,226 | 10.71 |
| S098 .... Entered 2000 or later | 3,791 | 1.83 |
| S099 .... Entered before 2000 | 18,435 | 8.88 |
| S100 .. Foreign born | 185,298 | 89.29 |
| S101 .... Entered 2000 or later | 71,684 | 34.54 |
| S102 .... Entered before 2000 | 113,614 | 54.75 |
| WORLD REGION OF BIRTH OF FOREIGN BORN | | |
| S103 Foreign-born population, excl population | 185,298 | 100.00 |
| S104 .. Europe | 65,831 | 35.53 |
| S105 .. Asia | 60,815 | 32.82 |
| S106 .. Africa | 5,223 | 2.82 |
| S107 .. Oceania | 2,197 | 1.19 |
| S108 .. Latin America | 45,595 | 24.61 |
| S109 .. Northern America | 5,637 | 3.04 |
| LANGUAGE SPOKEN AT HOME | | |
| S110 Population 5 years and over | 678,949 | 100.00 |
| S111 English only | 447,632 | 65.93 |
| S112 Language other than English | 231,317 | 34.07 |
| S113 .. Speak English less than "very well" | 77,435 | 11.41 |
| S114 .. Spanish | 82,151 | 12.10 |
| S115 .... Speak English less than "very well" | 28,932 | 4.26 |
| S116 .. Other Indo-European languages | 89,728 | 13.22 |
| S117 .... Speak English less than "very well" | 25,644 | 3.78 |
| S118 .. Asian and Pacific Islander languages | 48,242 | 7.11 |
| S119 .... Speak English less than "very well" | 20,747 | 3.06 |
| S120 .. Other languages | 11,196 | 1.65 |
| S121 .... Speak English less than "very well" | 2,112 | 0.31 |
| ANCESTRY | | |
| S122 Total population | 708,096 | 100.00 |
| S123 .. American | 43,026 | 6.08 |
| S124 .. Arab | 10,147 | 1.43 |
| S125 .. Czech | 4,917 | 0.69 |
| S126 .. Danish | 1,698 | 0.24 |
| S127 .. Dutch | 4,137 | 0.58 |
| S128 .. English | 40,647 | 5.74 |
| S129 .. French (except Basque) | 17,455 | 2.47 |
| S130 .. French Canadian | 2,592 | 0.37 |
| S131 .. German | 59,353 | 8.38 |
| S132 .. Greek | 11,544 | 1.63 |
| S133 .. Hungarian | 6,513 | 0.92 |
| S134 .. Irish | 78,259 | 11.05 |
| S135 .. Italian | 62,583 | 8.84 |
| S136 .. Lithuanian | 2,294 | 0.32 |
| S137 .. Norwegian | 4,940 | 0.70 |
| S138 .. Polish | 46,721 | 6.60 |
| S139 .. Portuguese | 3,296 | 0.47 |
| S140 .. Russian | 44,998 | 6.35 |
| S141 .. Scotch-Irish | 2,649 | 0.37 |
| S142 .. Scottish | 12,924 | 1.83 |
| S143 .. Slovak | 1,059 | 0.15 |
| S144 .. Subsaharan African | 2,073 | 0.29 |
| S145 .. Swedish | 5,808 | 0.82 |
| S146 .. Swiss | 3,571 | 0.50 |
| S147 .. Ukrainian | 6,679 | 0.94 |
| S148 .. Welsh | 3,709 | 0.52 |
| S149 .. West Indian (excluding Hispanic origin groups) | 3,802 | 0.54 |
Based on data from Census 2010 and American Community Survey
Developed using ProximityOne S&O Server -- http://proximityone.com/s&o/guide/server.htm
Economic Characteristics
DP3 Economic Characteristics
| New York Congressional District 12 | | |
| DP3 - Economic Characteristics | Number | Percent |
| EMPLOYMENT STATUS | | |
| E001 Population 16 years and over | 633,956 | 100.00 |
| E002 .. In labor force | 451,440 | 71.21 |
| E003 .... Civilian labor force | 451,172 | 71.17 |
| E004 ...... Employed | 418,816 | 66.06 |
| E005 ...... Unemployed | 32,356 | 5.10 |
| E006 .... Armed Forces | 268 | 0.04 |
| E007 .. Not in labor force | 182,516 | 28.79 |
| E008 .. Civilian labor force | 451,172 | 71.17 |
| E009 .... Percent Unemployed | 7.20 | |
| E010 Females 16 years and over | 339,307 | 53.52 |
| E011 .. In labor force | 225,129 | 35.51 |
| E012 .. Civilian labor force | 225,055 | 35.50 |
| E013 .. Employed | 206,520 | 32.58 |
| E014 .... Own children under 6 years | 33,317 | 5.26 |
| E015 All parents in family in labor force | 19,420 | 3.06 |
| E016 .. Own children 6 to 17 years | 46,893 | 7.40 |
| E017 All parents in family in labor force | 30,001 | 4.73 |
| COMMUTING TO WORK | | |
| E018 Workers 16 years and over | 411,603 | 100.00 |
| E019 .. Car, truck, or van -- drove alone | 28,843 | 7.01 |
| E020 .. Car, truck, or van -- carpooled | 7,364 | 1.79 |
| E021 .. Public transportation (excluding taxicab) | 239,718 | 58.24 |
| E022 .. Walked | 89,604 | 21.77 |
| E023 .. Other means | 22,390 | 5.44 |
| E024 .. Worked at home | 23,684 | 5.75 |
| E025 Mean travel time to work (minutes) | 29.50 | |
| OCCUPATION | | |
| E026 Civilian employed population 16 years and over | 418,816 | 100.00 |
| E027 .. Management, business, science, and arts | 265,222 | 63.33 |
| E028 .. Service | 41,673 | 9.95 |
| E029 .. Sales and office | 90,089 | 21.51 |
| E030 .. Natural resources, construction, and maintenance | 8,430 | 2.01 |
| E031 .. Production, transportation, and material moving | 13,402 | 3.20 |
| INDUSTRY | | |
| E032 Civilian employed population 16 years and over | 418,816 | 100.00 |
| E033 .. Agriculture, forestry, fishing & hunting & mining | 146 | 0.03 |
| E034 .. Construction | 7,832 | 1.87 |
| E035 .. Manufacturing | 15,183 | 3.63 |
| E036 .. Wholesale trade | 9,484 | 2.26 |
| E037 .. Retail trade | 30,733 | 7.34 |
| E038 .. Transportation, warehousing, utilities | 6,227 | 1.49 |
| E039 .. Information | 32,657 | 7.80 |
| E040 .. Finance & insurance, real estate & rental | 75,674 | 18.07 |
| E041 .. Professional, scientific, management, admin | 92,159 | 22.00 |
| E042 .. Educational services, health care & social assist | 75,569 | 18.04 |
| E043 .. Arts, entertainment, recreation, accommodations | 45,072 | 10.76 |
| E044 .. Other services, except public administration | 16,587 | 3.96 |
| E045 .. Public administration | 11,493 | 2.74 |
| CLASS OF WORKER | | |
| E046 Civilian employed population 16 years and over | 418,816 | 100.00 |
| E047 .. Private wage and salary workers | 357,512 | 85.36 |
| E048 .. Government workers | 29,055 | 6.94 |
| E049 .. Self-employed & not incorporated business | 31,610 | 7.55 |
| E050 .. Unpaid family workers | 639 | 0.15 |
| INCOME AND BENEFITS (2010 INFLATION-ADJUSTED DOLLARS) | | |
| E051 Total households | 359,499 | 100.00 |
| E052 .. Less than $10,000 | 28,359 | 7.89 |
| E053 .. $10,000 to $14,999 | 13,811 | 3.84 |
| E054 .. $15,000 to $24,999 | 26,669 | 7.42 |
| E055 .. $25,000 to $34,999 | 19,513 | 5.43 |
| E056 .. $35,000 to $49,999 | 28,720 | 7.99 |
| E057 .. $50,000 to $74,999 | 49,681 | 13.82 |
| E058 .. $75,000 to $99,999 | 37,082 | 10.31 |
| E059 .. $100,000 to $149,999 | 51,073 | 14.21 |
| E060 .. $150,000 to $199,999 | 34,095 | 9.48 |
| E061 .. $200,000 or more | 70,496 | 19.61 |
| E062 Median household income (dollars) | 82,360 | |
| E063 Mean household income (dollars) | 144,056 | |
| E064 With earnings | 294,814 | 82.01 |
| E065 .. Mean earnings (dollars) | 144,121 | |
| E066 With Social Security | 74,403 | 20.70 |
| E067 .. Mean Social Security income (dollars) | 17,888 | |
| E068 With retirement income | 34,752 | 9.67 |
| E069 .. Mean retirement income (dollars) | 36,784 | |
| E070 With Supplemental Security Income | 12,475 | 3.47 |
| E071 .. Mean Supplemental Security Income (dollars) | 9,254 | |
| E072 With cash public assistance income | 5,562 | 1.55 |
| E073 .. Mean cash public assistance income (dollars) | 4,419 | |
| E074 With Food Stamp/SNAP benefits past 12 months | 26,620 | 7.40 |
| E075 Families | 128,135 | 100.00 |
| E076 .. Less than $10,000 | 5,147 | 4.02 |
| E077 .. $10,000 to $14,999 | 3,664 | 2.86 |
| E078 .. $15,000 to $24,999 | 8,081 | 6.31 |
| E079 .. $25,000 to $34,999 | 6,700 | 5.23 |
| E080 .. $35,000 to $49,999 | 7,822 | 6.10 |
| E081 .. $50,000 to $74,999 | 13,331 | 10.40 |
| E082 .. $75,000 to $99,999 | 8,702 | 6.79 |
| E083 .. $100,000 to $149,999 | 20,414 | 15.93 |
| E084 .. $150,000 to $199,999 | 13,466 | 10.51 |
| E085 .. $200,000 or more | 40,808 | 31.85 |
| E086 .. Median family income (dollars) | 120,016 | |
| E087 .. Mean family income (dollars) | 210,288 | |
| E088 Per capita income (dollars) | 75,700 | |
| E089 Nonfamily households | 231,364 | 64.36 |
| E090 .. Median nonfamily income (dollars) | 70,379 | |
| E091 .. Mean nonfamily income (dollars) | 106,197 | |
| E092 Median earnings for workers (dollars) | 56,712 | |
| E093 Median earnings for male full-time, year-round worker | 85,672 | |
| E094 Median earnings for female full-time, year-round work | 65,852 | |
| HEALTH INSURANCE COVERAGE | | |
| E095 Civilian noninstitutionalized population | 702,663 | 100.00 |
| E096 .. With health insurance coverage | 630,526 | 89.73 |
| E097 .. With private health insurance | 533,736 | 75.96 |
| E098 .. With public coverage | 156,148 | 22.22 |
| E099 .. No health insurance coverage | 72,137 | 10.27 |
| E100 .. Civilian noninstitutionalized population under 18 | 81,811 | 11.64 |
| E101 .. No health insurance coverage | 1,690 | 0.24 |
| E102 .. Civilian noninstitutionalized population 18 to 64 | 522,612 | 74.38 |
| E103 .. In labor force: | 421,935 | 60.05 |
| E104 .... Employed: | 392,058 | 55.80 |
| E105 .... With health insurance coverage | 348,754 | 49.63 |
| E106 .... With private health insurance | 337,045 | 47.97 |
| E107 ...... With public coverage | 13,867 | 1.97 |
| E108 .... No health insurance coverage | 43,304 | 6.16 |
| E109 .. Unemployed: | 29,877 | 4.25 |
| E110 .... With health insurance coverage | 19,220 | 2.74 |
| E111 ...... With private health insurance | 14,698 | 2.09 |
| E112 ...... With public coverage | 5,832 | 0.83 |
| E113 .... No health insurance coverage | 10,657 | 1.52 |
| E114 .. Not in labor force: | 100,677 | 14.33 |
| E115 .... With health insurance coverage | 85,921 | 12.23 |
| E116 ...... With private health insurance | 62,032 | 8.83 |
| E117 ...... With public coverage | 27,919 | 3.97 |
| E118 .... No health insurance coverage | 14,756 | 2.10 |
| Percent Families & People; Income past year below poverty le | | |
| E119 All families | 8.5 | |
| E120 .. With related children under 18 years | 10.2 | |
| E121 .. With related children under 5 years only | 3.7 | |
| E122 .. Married couple families | 4.3 | |
| E123 .... With related children under 18 years | 3.3 | |
| E124 .... With related children under 5 years only | 0.4 | |
| E125 .. Families w/female householder, no husband present | 25.4 | |
| E126 .... With related children under 18 years | 29.7 | |
| E127 .... With related children under 5 years only | 22.0 | |
| E128 All people | 12.9 | |
| E129 .. Under 18 years | 13.1 | |
| E130 .. Related children under 18 years | 12.8 | |
| E131 .... Related children under 5 years | 8.7 | |
| E132 .... Related children 5 to 17 years | 15.2 | |
| E133 .. 18 years and over | 12.8 | |
| E134 .... 18 to 64 years | 13.0 | |
| E135 .. 65 years and over | 12.2 | |
| E136 People in families | 9.3 | |
| E137 Unrelated individuals 15 years and over | 16.8 | |
Based on data from Census 2010 and American Community Survey
Developed using ProximityOne S&O Server -- http://proximityone.com/s&o/guide/server.htm
Housing Characteristics
DP4 Housing Characteristics
| New York Congressional District 12 | | |
| DP4 - Housing Characteristics | Number | Percent |
| HOUSING OCCUPANCY | | |
| H001 Total housing units | 425,426 | 100.00 |
| H002 .. Occupied housing units | 359,499 | 84.50 |
| H003 .. Vacant housing units | 65,927 | 15.50 |
| H004 Homeowner vacancy rate | 3.50 | |
| H005 Rental vacancy rate | 2.70 | |
| UNITS IN STRUCTURE | | |
| H006 Total housing units | 425,426 | 100.00 |
| H007 .. 1-unit, detached | 5,510 | 1.30 |
| H008 .. 1-unit, attached | 3,892 | 0.91 |
| H009 .. 2 units | 11,225 | 2.64 |
| H010 .. 3 or 4 units | 17,865 | 4.20 |
| H011 .. 5 to 9 units | 41,466 | 9.75 |
| H012 .. 10 to 19 units | 39,078 | 9.19 |
| H013 .. 20 or more units | 306,352 | 72.01 |
| H014 .. Mobile home | 38 | 0.01 |
| H015 .. Boat, RV, van, etc. | 0 |
| YEAR STRUCTURE BUILT | | |
| H016 Total housing units | 425,426 | 100.00 |
| H017 .. Built 2005 or later | 18,700 | 4.40 |
| H018 .. Built 2000 to 2004 | 17,839 | 4.19 |
| H019 .. Built 1990 to 1999 | 15,303 | 3.60 |
| H020 .. Built 1980 to 1989 | 25,788 | 6.06 |
| H021 .. Built 1970 to 1979 | 38,300 | 9.00 |
| H022 .. Built 1960 to 1969 | 63,643 | 14.96 |
| H023 .. Built 1950 to 1959 | 44,941 | 10.56 |
| H024 .. Built 1940 to 1949 | 34,927 | 8.21 |
| H025 .. Built 1939 or earlier | 165,985 | 39.02 |
| ROOMS | | |
| H026 Total housing units | 425,426 | 100.00 |
| H027 .. 1 room | 52,116 | 12.25 |
| H028 .. 2 rooms | 60,208 | 14.15 |
| H029 .. 3 rooms | 131,484 | 30.91 |
| H030 .. 4 rooms | 98,246 | 23.09 |
| H031 .. 5 rooms | 49,664 | 11.67 |
| H032 .. 6 rooms | 15,905 | 3.74 |
| H033 .. 7 rooms | 7,025 | 1.65 |
| H034 .. 8 rooms | 3,378 | 0.79 |
| H035 .. 9 rooms or more | 7,400 | 1.74 |
| H036 Median rooms | 3.3 | |
| BEDROOMS | | |
| H037 Total housing units | 425,426 | 100.00 |
| H038 .. No bedroom | 63,305 | 14.88 |
| H039 .. 1 bedroom | 186,405 | 43.82 |
| H040 .. 2 bedrooms | 123,168 | 28.95 |
| H041 .. 3 bedrooms | 40,899 | 9.61 |
| H042 .. 4 bedrooms | 8,800 | 2.07 |
| H043 .. 5 or more bedrooms | 2,849 | 0.67 |
| HOUSING TENURE | | |
| H044 Occupied housing units | 359,499 | 100.00 |
| H045 .. Owner-occupied | 96,174 | 26.75 |
| H046 .. Renter-occupied | 263,325 | 73.25 |
| H047 Average household size of owner-occupied unit | 1.93 | |
| H048 Average household size of renter-occupied unit | 1.89 | |
| YEAR HOUSEHOLDER MOVED INTO UNIT | | |
| H049 Occupied housing units | 359,499 | 100.00 |
| H050 .. Moved in 2005 or later | 194,465 | 54.09 |
| H051 .. Moved in 2000 to 2004 | 40,765 | 11.34 |
| H052 .. Moved in 1990 to 1999 | 54,537 | 15.17 |
| H053 .. Moved in 1980 to 1989 | 27,690 | 7.70 |
| H054 .. Moved in 1970 to 1979 | 26,918 | 7.49 |
| H055 .. Moved in 1969 or earlier | 15,124 | 4.21 |
| VEHICLES AVAILABLE | | |
| H056 Occupied housing units | 359,499 | 100.00 |
| H057 .. No vehicles available | 271,401 | 75.49 |
| H058 .. 1 vehicle available | 78,648 | 21.88 |
| H059 .. 2 vehicles available | 7,962 | 2.21 |
| H060 .. 3 or more vehicles available | 1,488 | 0.41 |
| HOUSE HEATING FUEL | | |
| H061 Occupied housing units | 359,499 | 100.00 |
| H062 .. Utility gas | 172,755 | 48.05 |
| H063 .. Bottled, tank, or LP gas | 4,118 | 1.15 |
| H064 .. Electricity | 70,453 | 19.60 |
| H065 .. Fuel oil, kerosene, etc. | 97,648 | 27.16 |
| H066 .. Coal or coke | 83 | 0.02 |
| H067 .. Wood | 108 | 0.03 |
| H068 .. Solar energy | 0 |
| H069 .. Other fuel | 8,316 | 2.31 |
| H070 .. No fuel used | 6,018 | 1.67 |
| SELECTED CHARACTERISTICS | | |
| H071 Occupied housing units | 359,499 | 100.00 |
| H072 .. Lacking complete plumbing facilities | 1,963 | 0.55 |
| H073 .. Lacking complete kitchen facilities | 4,459 | 1.24 |
| H074 .. No telephone service available | 22,309 | 6.21 |
| OCCUPANTS PER ROOM | | |
| H075 Occupied housing units | 359,499 | 100.00 |
| H076 .. 1.00 or less | 343,245 | 95.48 |
| H077 .. 1.01 to 1.50 | 7,337 | 2.04 |
| H078 .. 1.51 or more | 8,917 | 2.48 |
| VALUE | | |
| H079 Owner-occupied units | 96,174 | 100.00 |
| H080 .. Less than $50,000 | 796 | 0.83 |
| H081 .. $50,000 to $99,999 | 484 | 0.50 |
| H082 .. $100,000 to $149,999 | 899 | 0.93 |
| H083 .. $150,000 to $199,999 | 757 | 0.79 |
| H084 .. $200,000 to $299,999 | 2,949 | 3.07 |
| H085 .. $300,000 to $499,999 | 12,587 | 13.09 |
| H086 .. $500,000 to $999,999 | 39,820 | 41.40 |
| H087 .. $1,000,000 or more | 37,882 | 39.39 |
| H088 Median (dollars) | 857,900 | |
| MORTGAGE STATUS | | |
| H089 Owner-occupied units | 96,174 | 100.00 |
| H090 .. Housing units with a mortgage | 51,902 | 53.97 |
| H091 .. Housing units without a mortgage | 44,272 | 46.03 |
| SELECTED MONTHLY OWNER COSTS (SMOC) | | |
| H092 Housing units with a mortgage | 51,902 | 100.00 |
| H093 .. Less than $300 | 315 | 0.61 |
| H094 .. $300 to $499 | 193 | 0.37 |
| H095 .. $500 to $699 | 1,359 | 2.62 |
| H096 .. $700 to $999 | 2,684 | 5.17 |
| H097 .. $1,000 to $1,499 | 2,758 | 5.31 |
| H098 .. $1,500 to $1,999 | 5,958 | 11.48 |
| H099 .. $2,000 or more | 38,635 | 74.44 |
| H100 Median (dollars) | 3,171 | |
| H101 Housing units without a mortgage | 44,272 | 100.00 |
| H102 .. Less than $100 | 2,535 | 5.73 |
| H103 .. $100 to $199 | 1,744 | 3.94 |
| H104 .. $200 to $299 | 1,197 | 2.70 |
| H105 .. $300 to $399 | 2,289 | 5.17 |
| H106 .. $400 or more | 36,507 | 82.46 |
| H107 Median (dollars) | 1,000+ | |
| Selected Monthly Owner Costs as % Household Income | | |
| H108 Housing units with a mortgage | 51,561 | 100.00 |
| H109 .. Less than 20.0 percent | 24,561 | 47.63 |
| H110 .. 20.0 to 24.9 percent | 5,658 | 10.97 |
| H111 .. 25.0 to 29.9 percent | 4,161 | 8.07 |
| H112 .. 30.0 to 34.9 percent | 4,806 | 9.32 |
| H113 .. 35.0 percent or more | 12,375 | 24.00 |
| H114 .. Not computed | 341 | 0.66 |
| H115 Housing unit without a mortgage | 43,692 | 100.00 |
| H116 .. Less than 10.0 percent | 20,154 | 46.13 |
| H117 .. 10.0 to 14.9 percent | 6,085 | 13.93 |
| H118 .. 15.0 to 19.9 percent | 3,563 | 8.15 |
| H119 .. 20.0 to 24.9 percent | 1,863 | 4.26 |
| H120 .. 25.0 to 29.9 percent | 1,904 | 4.36 |
| H121 .. 30.0 to 34.9 percent | 1,161 | 2.66 |
| H122 .. 35.0 percent or more | 8,962 | 20.51 |
| H123 .. Not computed | 580 | 1.33 |
| GROSS RENT | | |
| H124 Occupied units paying rent | 257,530 | 100.00 |
| H125 .. Less than $200 | 2,118 | 0.82 |
| H126 .. $200 to $299 | 6,866 | 2.67 |
| H127 .. $300 to $499 | 8,851 | 3.44 |
| H128 .. $500 to $749 | 17,761 | 6.90 |
| H129 .. $750 to $999 | 17,540 | 6.81 |
| H130 .. $1,000 to $1,499 | 51,055 | 19.82 |
| H131 .. $1,500 or more | 153,339 | 59.54 |
| H132 Median (dollars) | 1,702 | |
| H133 No rent paid | 5,795 | 2.25 |
| Gross Rent as % of Household Income(GRAPI) | | |
| H134 Occupied units paying rent | 251,285 | 100.00 |
| H135 .. Less than 15.0 percent | 48,533 | 19.31 |
| H136 .. 15.0 to 19.9 percent | 30,837 | 12.27 |
| H137 .. 20.0 to 24.9 percent | 29,785 | 11.85 |
| H138 .. 25.0 to 29.9 percent | 29,678 | 11.81 |
| H139 .. 30.0 to 34.9 percent | 23,425 | 9.32 |
| H140 .. 35.0 percent or more | 89,027 | 35.43 |
| H141 Not computed | 12,040 | 4.79 |
Based on data from Census 2010 and American Community Survey
Developed using ProximityOne S&O Server -- http://proximityone.com/s&o/guide/server.htm
Support Using these Resources
Learn more about demographic economic data and related analytical tools.
Join us in a Decision-Making Information Web session.
There is no fee for these Web sessions.
Each informal session is focused on a specific topic.
The open structure also provides for Q&A and discussion of application issues of interest to participants.
ProximityOne User Group
Join the ProximityOne User Group
to keep up-to-date with new developments relating to geographic-demographic-economic decision-making information resources.
Receive updates and access to tools and resources available only to members.
Use this form to join the User Group.
There is no fee.
Additional Information
ProximityOne develops geographic-demographic-economic data and analytical tools and helps organizations knit together and use diverse data in a decision-making and analytical framework. We develop custom demographic/economic estimates and projections, develop geographic and geocoded address files, and assist with impact and geospatial analyses.
Wide-ranging organizations use our software, data and methodologies to analyze their own data integrated with other data.
Follow ProximityOne on Twitter at
www.twitter.com/proximityone.
Contact ProximityOne (888-364-7656) with questions about data covered in this section or to discuss custom estimates, projections or analyses for your areas of interest.
|
