|
|
|
- S&O Desktop - S&O Profiles|Reports > Comparative > Narrative > Site Analysis CVXE GIS Tools Data Resources Guide - projections to 2060 Related Sections - Situation & Outlook - Applications Gallery - States - Congressional District - School Districts - Counties - Cities/Places - Tracts/Neighborhoods - Block Groups - Census Blocks - Urban Areas Estimates-Projections - 2060 Demographic ... all county interactive table - 2030 Demographic-Economic - Single Year of Age GIS Thematic Mapping Visual Analysis Tools Ranking Tables National Scope Demographic Change 2000-2010 - States - Metros - Congressional District - School Districts - Counties - Cities/Places - Census Tracts |
Mapping Poverty in America -- Poverty Patterns by Census Tract & School District
click graphic for info; hover to pause The poverty rate is an economic indicator that measures the percentage of people with income below the poverty threshold. Some businesses serve markets where knowing poverty incidence for small area geography can make an important difference in locating stores and how/what services are provided. Poverty incidence patterns can provide insights into why certain areas are performing better or not as well as others. Combining poverty incidence data with business operations and sales data can improve decision-making capabilities for many types of businesses. The public sector also uses poverty incidence data. Federal and state governments use these estimates in funding formulas to allocate funds to local communities. Local communities often use these estimates to identify the number of individuals or families eligible for various programs. Various research and stakeholder organizations utilize poverty incidence data to examine and report on cause and effect relationships and trends. This section reviews use of U.S. national scope GIS resources that can be used to meet these types of analytical and decision-making needs. Use these tools to visually and geospatially analyze patterns of poverty incidence by census tract contextually by school district, city, county or custom-defined area. The GIS project files may be downloaded and used by members of the ProximityOne User Group (sign-up here). The following graphic illustrates use of the GIS project using the CV XE GIS software to show patterns of poverty incidence by census tract in the Houston, Texas area. School districts (2011-12 school year) are shown with bold black boundaries and labeled with district name. Houston Area Patterns of Poverty by Census Tract/School District 
Click graphic for larger view; see related views: Kansas City ... Los Angeles ... Phoenix The legend to left of map shows percent population in poverty: intervals and color assignment. The identify tool is used to display a mini-profile of a census tract (see pointer). The mini-profile, inset in right section of map, shows attributes of this census tract (tract 310100 located in county 201 of state 48). Selected demographic attributes are based on the 2012 American Community Survey 5-year estimates (ACS0812): Items Shown in Mini-Profile
The thematic pattern shown in the map view above is based on the PctPov item. Users of the GIS project may use other items to show different patterns/types of poverty incidence. Associated Interactive Analysis Tables The demographic items are taken from the datasets used in the associated interactive analysis tables. Use these tables to interactively view, query, compare, rank demographic-economic items. The "d" items shown in list of items above (Table ItemName) are taken from the General Demographics table. The "e" items (Table ItemName) are taken from the Economic Characteristics table. Measuring Poverty Status Poverty status is determined by comparing annual income to a set of dollar values called poverty thresholds that vary by family size, the number of related children, and the age of the householder. If a family before-tax money income is less than the dollar value of the corresponding threshold, then that family and every individual in it are considered to be in poverty. For people not living in families, poverty status is determined by comparing the individual's income to a poverty threshold for one adult. Poverty thresholds are updated annually to allow for changes in the cost of living using the Consumer Price Index (CPI-U). ' They do not vary geographically. The ACS is a continuous survey, and people respond throughout the year. Since income is reported for the previous 12 months, the appropriate poverty threshold for each family is determined by multiplying the base-year poverty threshold (1982) by the average of monthly CPI values for the 12 months preceding the survey month. Join the User Group -- there is no fee Join the ProximityOne User Group ... download and use the Mapping Poverty in America GIS project. Sign-up here. Kansas City Area Patterns of Poverty by Census Tract/School District Click graphic for larger view. 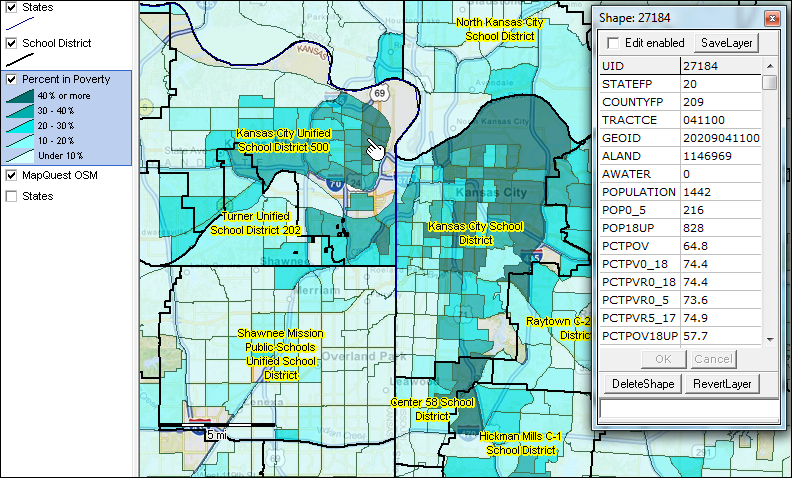
Los Angeles Area Patterns of Poverty by Census Tract/School District Click graphic for larger view. 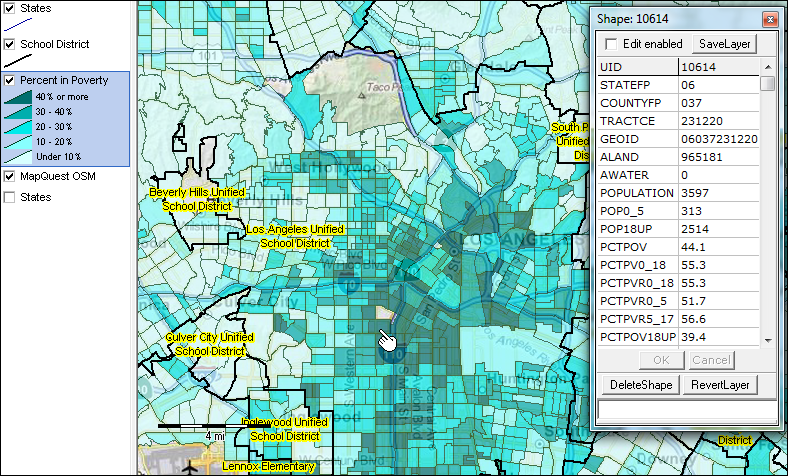
Phoenix Area Patterns of Poverty by Census Tract/School District Click graphic for larger view. 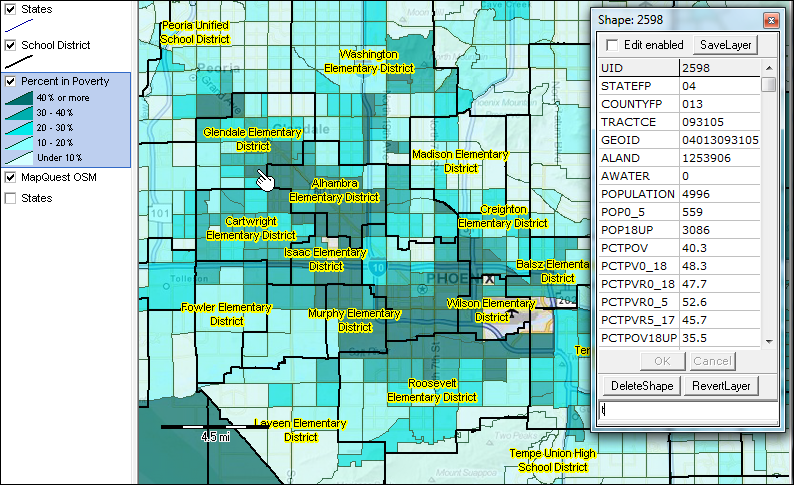
Make your own map with your own style and areas of interest. Zoom in to any level. Label geography as desired. Add other data/geography. Join the User Group ... download and use the Mapping Poverty in America GIS project. No fee. Sign-up here. Additional Information ProximityOne develops geodemographic-economic data and analytical tools and helps organizations knit together and use diverse data in a decision-making and analytical framework. We develop custom demographic/economic estimates and projections, develop geographic and geocoded address files, and assist with impact and geospatial analyses. Wide-ranging organizations use our tools (software, data, methodologies) to analyze their own data integrated with other data. Follow ProximityOne on Twitter at www.twitter.com/proximityone. Contact us (888-364-7656) with questions about data covered in this section or to discuss custom estimates, projections or analyses for your areas of interest. |
|
|