ProximityOne Home Page Resources to create and apply insight


  Hispanic Demographics
  - Census 2010
  - Hispanic by Specific Origin
    • State, County, Tract

  Related Sections
  - Applications Gallery
  - States
  - Metros
  - Congressional District
  - Counties
  - Cities/Places
  - Tracts/Neighborhoods
  - Census Blocks

  Estimates-Projections
  - 2060 Demographic
    ... all county interactive table
  - 2030 Demographic-Economic
  - Single Year of Age

  Demographic-Economic
    Estimates-Projections

  GIS Thematic Mapping
    Visual Analysis Tools

  Ranking Tables
    National Scope
    Demographic Change
    2000-2010
  - States
  - Metros
  - Congressional District
  - School Districts
  - Counties
  - Cities/Places
  - Census Tracts


Hispanic Population by Specific Origin
  -- distribution by county & census tract
Decision-Making Information
  ProximityOne
  information resources & solutions
  (888) DMI-SOLN
  (888) 364-7656


Visual analysis with ProximityOne tools
click graphic for info; hover to pause

 
visually analyze clients/markets
site analysis using 1 mile radius

S1

$median household income
patterns by census tract - Houston

hover to pause

113th Congressional Districts

Click for info

US Asian Indian population 2010

Click for info

geocoded students and school
McKinney ISD, TX

Click for info

geocoded students and school
with tax parcels & streets

Click for info

high school attendance zones
with schools by type

Click for info

%high school graduates by
census tract - Puerto Rico

Click for info

Austin, TX MSA counties &
places 10K+ population markers

Click for info

Appalachia counties (green) &
coalfield counties (orange)

Click for info

China provinces percent urban &
cities (markers) by state plan

Click for info

Honolulu census tracts (red)
& census blocks


Central Park area NYC

Click for info

Kansas City Metro & Counties
Home Depot locations (markers)

Click for info

World Cities; focus on Spain

Click for info


Decision-Making Information Blog
Examining Neighborhood Change

Support & Technical Assistance
help using these resources


As of 2012, the total U.S. Hispanic origin population was estimated to be 60 million based on ACS2012. The U.S. Hispanic population is a mosaic of many different specific origins (e.g., Costa Rica, Nicaragua, Panama, among many others reviewed below). This section is focused on resources to analyze the distribution of the Hispanic population by specific origin. These data, and insights from their analysis, can help groups, associations and other stakeholders better understand the distribution and characteristics of specific origin Hispanic populations to provide support and care services. The data can assist government agencies better communicate with specific Hispanic origin groups by understanding the distribution by specific origin and identify special needs by geography. They can help businesses better supply the types of products and services that might be needed and in demand for people of specific origins by geographic area.

Interactive Tables & GIS/Geospatial Analysis
Use the interactive table in this section to view, rank, compare the distribution of the Hispanic population by specific origin for the U.S. by state and county. Use the U.S. by county and/or census tract shapefile with integrated Hispanic population by specific origin data to view pattern maps and geospatially analyze the specific origin populations with GIS tools. See more about the Hispanic by Specific Origin (HSO) U.S. by County GIS Project.

Visual Analysis of Hispanic Population by Specific Origin
Scroll section -- click graphic for larger view and details.
Selected areas: U.S., Houston, Los Angeles, Washington ...
Percent Population Mexican Origin by County; 2012

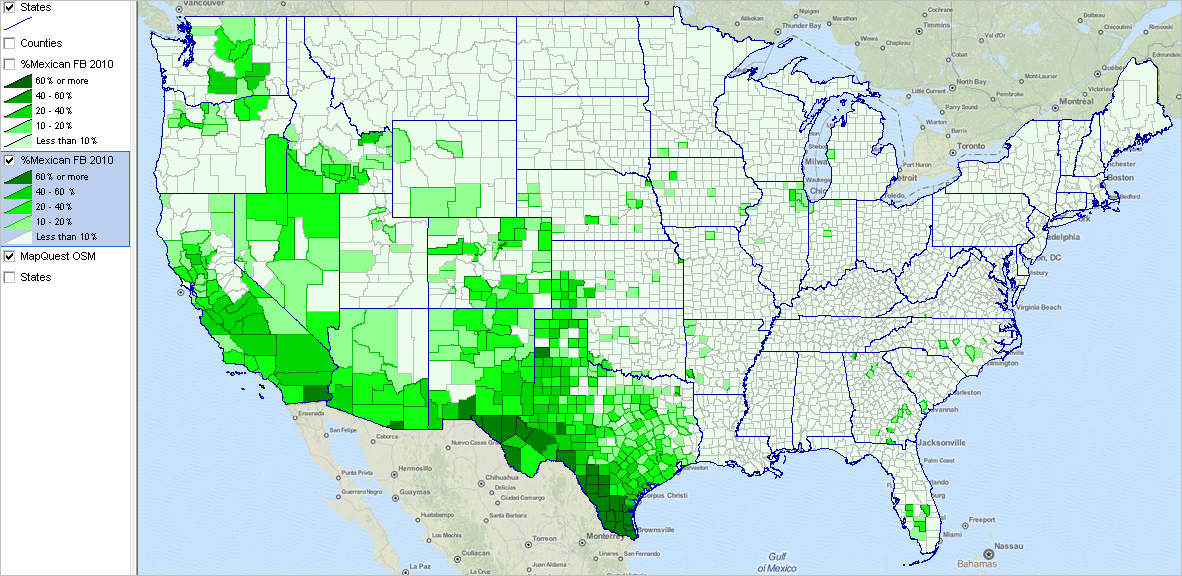
Percent Population Mexican Origin -- Harris County, TX Area by Tract; 2010

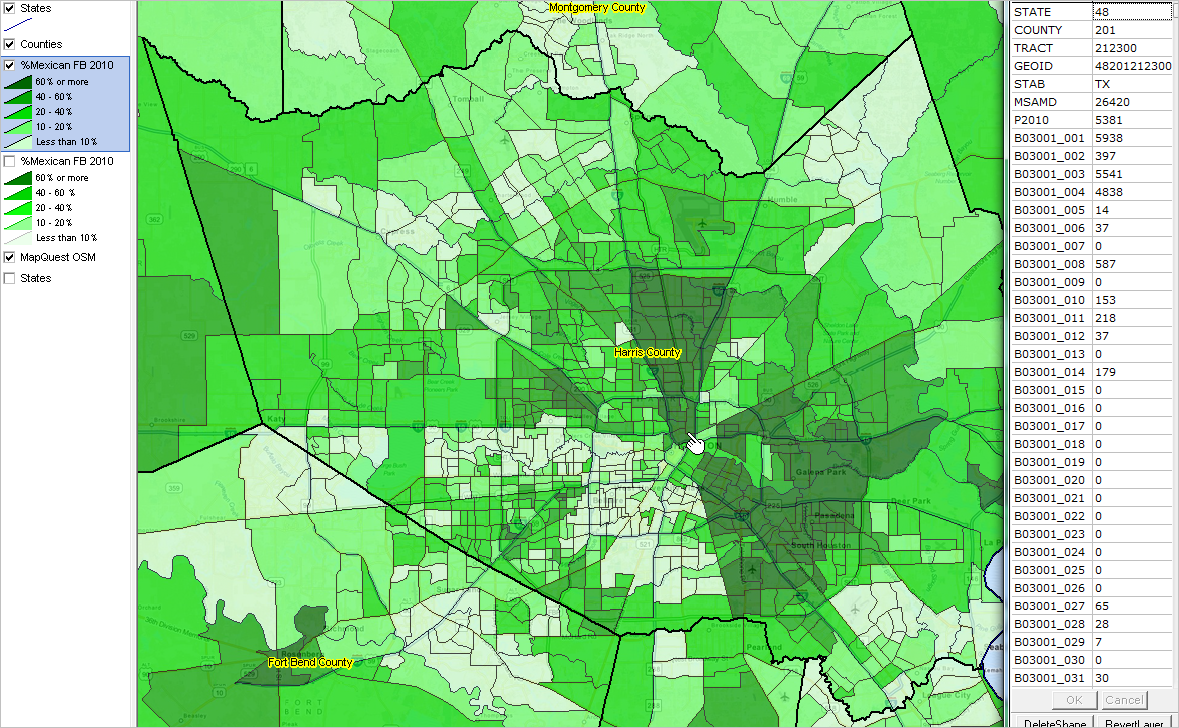
Percent Population Mexican Origin -- Los Angeles Area by Tract; 2010

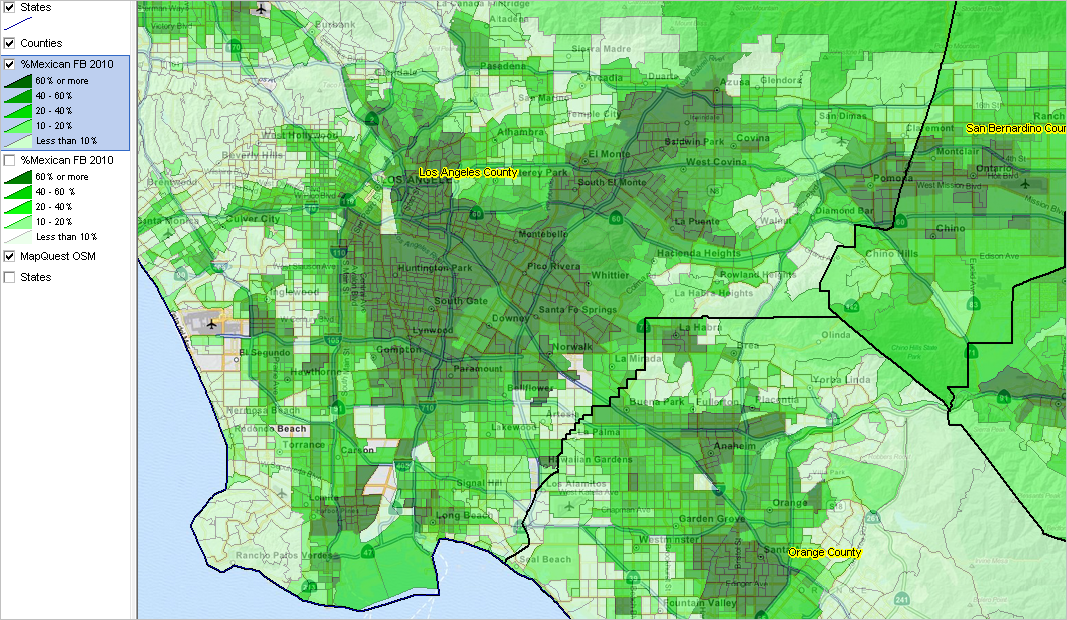
Percent Population Hispanic Origin -- Washington DC Area by Tract; 2010
Map views developed using CV XE GIS software and custom developed GIS projects.

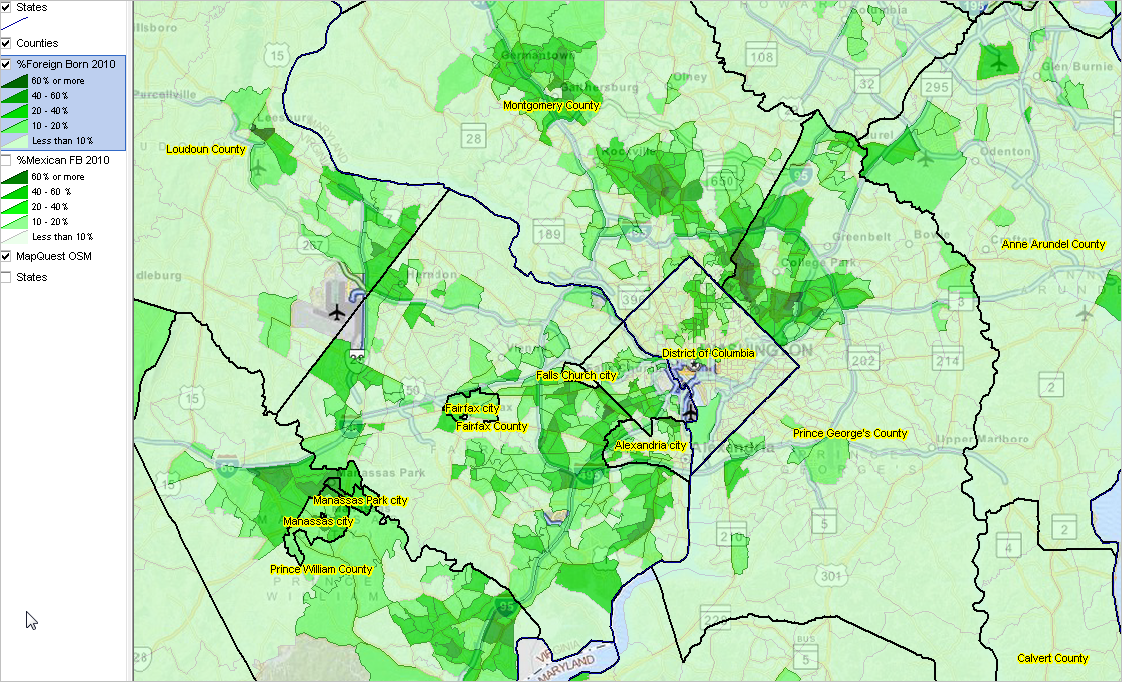
Hispanic Population by Specific Origin
ACS 1-year estimates; 2012; see 2010, 2011, 2012, and change 2010-2012 estimates
ItemOriginPopulation 20122012%
001 Total: 313,914,040 100.00
002    Not Hispanic or Latino 260,953,023 83.13
003    Hispanic or Latino: 52,961,017 16.87
004      Mexican 34,038,599 10.84
005      Puerto Rican 4,970,604 1.58
006      Cuban 1,957,557 0.62
007      Dominican (Dominican Republic) 1,656,960 0.53
008      Central American: 4,760,337 1.52
009        Costa Rican 140,152 0.04
010        Guatemalan 1,241,560 0.40
011        Honduran 753,532 0.24
012        Nicaraguan 405,601 0.13
013        Panamanian 183,743 0.06
014        Salvadoran 1,992,754 0.63
015        Other Central American 42,995 0.01
016      South American: 3,148,370 1.00
017        Argentinean 248,823 0.08
018        Bolivian 103,296 0.03
019        Chilean 140,045 0.04
020        Colombian 1,039,923 0.33
021        Ecuadorian 662,633 0.21
022        Paraguayan 20,461 0.01
023        Peruvian 594,418 0.19
024        Uruguayan 60,178 0.02
025        Venezuelan 249,153 0.08
026        Other South American 29,440 0.01
027      Other Hispanic or Latino: 2,428,590 0.77
028        Spaniard 717,287 0.23
029        Spanish 530,484 0.17
030        Spanish American 26,663 0.01
031        All other Hispanic or Latino 1,154,156 0.37


Hispanic Population by Specific Origin 2010: U.S., State and County -- Interactive Table
  Click ShowAll button between Find/Queries.
  Use mouseover on column header to view column description.
  See ranking table usage notes below ranking table. See related ranking tables -- http://proximityone.com/rankingtables.htm.
  Chrome or Firefox recommended.


Usage Notes
  • All items are estimates centric to mid-2010.
  • Click ShowAll button between specific area queries.
  • Cells with -1 value could not be estimated (for this geography and this time frame).

Hispanic Population by Specific Origin
ACS 1-year estimates; 2010, 2011, 2012 and change 2010-2012
OriginPopulation 20102010%Population 20112011%Population 20122012%Population 2010-122010-12%
 Total: 309,349,689 100.00 311,591,919 100.00 313,914,040 100.00 4,564,351 1.45
    Not Hispanic or Latino 258,609,600 83.60 259,652,003 83.33 260,953,023 83.13 2,343,423 0.90
    Hispanic or Latino: 50,740,089 16.40 51,939,916 16.67 52,961,017 16.87 2,220,928 4.19
      Mexican 32,929,683 10.64 33,557,922 10.77 34,038,599 10.84 1,108,916 3.26
      Puerto Rican 4,691,890 1.52 4,885,294 1.57 4,970,604 1.58 278,714 5.61
      Cuban 1,873,585 0.61 1,891,014 0.61 1,957,557 0.62 83,972 4.29
      Dominican (Dominican Republic) 1,508,871 0.49 1,554,819 0.50 1,656,960 0.53 148,089 8.94
      Central American: 4,434,426 1.43 4,623,170 1.48 4,760,337 1.52 325,911 6.85
        Costa Rican 130,697 0.04 130,507 0.04 140,152 0.04 9,455 6.75
        Guatemalan 1,156,861 0.37 1,214,076 0.39 1,241,560 0.40 84,699 6.82
        Honduran 730,227 0.24 695,761 0.22 753,532 0.24 23,305 3.09
        Nicaraguan 383,896 0.12 387,104 0.12 405,601 0.13 21,705 5.35
        Panamanian 172,950 0.06 180,462 0.06 183,743 0.06 10,793 5.87
        Salvadoran 1,829,798 0.59 1,977,657 0.63 1,992,754 0.63 162,956 8.18
        Other Central American 29,997 0.01 37,603 0.01 42,995 0.01 12,998 30.23
      South American: 3,049,280 0.99 3,071,280 0.99 3,148,370 1.00 99,090 3.15
        Argentinean 236,558 0.08 240,195 0.08 248,823 0.08 12,265 4.93
        Bolivian 114,345 0.04 105,215 0.03 103,296 0.03 -11,049 -10.70
        Chilean 139,245 0.05 145,422 0.05 140,045 0.04 800 0.57
        Colombian 961,223 0.31 994,583 0.32 1,039,923 0.33 78,700 7.57
        Ecuadorian 650,348 0.21 655,300 0.21 662,633 0.21 12,285 1.85
        Paraguayan 20,683 0.01 24,933 0.01 20,461 0.01 -222 -1.08
        Peruvian 598,671 0.19 566,541 0.18 594,418 0.19 -4,253 -0.72
        Uruguayan 60,184 0.02 62,238 0.02 60,178 0.02 -6 -0.01
        Venezuelan 242,120 0.08 244,124 0.08 249,153 0.08 7,033 2.82
        Other South American 25,903 0.01 32,729 0.01 29,440 0.01 3,537 12.01
      Other Hispanic or Latino: 2,252,354 0.73 2,356,417 0.76 2,428,590 0.77 176,236 7.26
        Spaniard 694,494 0.22 704,700 0.23 717,287 0.23 22,793 3.18
        Spanish 482,072 0.16 518,924 0.17 530,484 0.17 48,412 9.13
        Spanish American 48,810 0.02 43,974 0.01 26,663 0.01 -22,147 -83.06
        All other Hispanic or Latino 1,026,978 0.33 1,088,819 0.35 1,154,156 0.37 127,178 11.02


Using the Hispanic by Specific Origin (HSO) U.S. by County GIS Project
Members of the ProximityOne User Group (join now, no fee) may download and use the Hispanic by Specific Origin (HSO) GIS project. Develop thematic pattern maps showing the distribution of any of the specific origin categories. Zoom-in to counties or regions of interest. Add labels for geography or subject matter. Add other geography and layers. Shown specific origin data as population or as percent of a related data item. View the data contained in the shapefile dbf in a tabular/spreadsheet format. Perform queries on the table and export selected data. The CV XE GIS HSO project start-up view is shown by the graphic presented below.


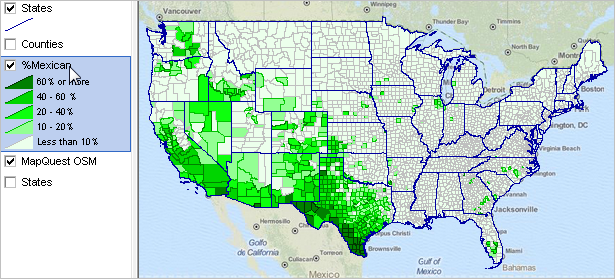
Support Using these Resources
Learn more about accessing and using ACS data integrated with other data; examine characteristics and patterns for your study areas and applications. Join us in a Decision-Making Information Web session. There is no fee for these one-hour Web sessions. Each informal session is focused on a specific topic. The open structure also provides for Q&A and discussion of application issues of interest to participants.

Additional Information
ProximityOne develops geographic-demographic-economic data and analytical tools and helps organizations knit together and use diverse data in a decision-making and analytical framework. We develop custom demographic/economic estimates and projections, develop geographic and geocoded address files, and assist with impact and geospatial analyses. Wide-ranging organizations use our tools (software, data, methodologies) to analyze their own data integrated with other data. Follow ProximityOne on Twitter at www.twitter.com/proximityone. Contact us (888-364-7656) with questions about data covered in this section or to discuss custom estimates, projections or analyses for your areas of interest.


Copyright © . Proximity. All Rights Reserved.
Sitemap | Contact Us | News