
|
|
|
... visual analysis of geographic-demographic-economic patterns Neighborhood demographic-economic patterns might be most effectively understood using GIS tools supplemented with tabular/spreadsheet data. Geographic Information System (GIS) applications provide an appealing and flexible way of visually examining thematic patterns ... such as patterns of median household income as one measure of economic prosperity. By combining different layers, such as counties, cities and census tracts, we are able to better understand patterns in the context of multiple types of geography. This section is focused on use of GIS and related geographic-demographic-economic data to examine neighborhood patterns. You can use resources described here to flexibly examine neighborhood patterns for your areas of interest. The GIS resources reviewed in this section are provided as a part of the ProximityOne User Group. Join now. Select a state in the scroll section below to view/analyze patterns in that state. Visual Analysis of Neighborhood Patterns The graphic presented below (click for larger view) shows a thematic pattern map of Texas census tracts by median household income. This graphic shows the "start-up" view of the GIS project described in this section. We will review how, in just a few steps, you can develop maps like this one for interactive use; perform geographic drill-down and navigation; label tracts and other geography; change attributes of patterns and/or variables used in thematic maps; add other layers; and examine the data in tabular form. Illustrative View: Texas by Neighborhood/Census Tract 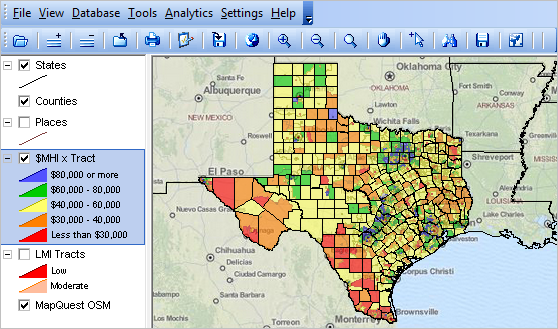
About the GIS Project The GIS project includes several shapefiles, represented as layers, and OpenStreetMaps (OSM) as an optional base layer. Use of the OSM requires an Internet connection. The OSM layer is optional. It can be deleted from the project, However, the automatic roads and topology view is then not available. Other than the OSM layer, there are no Internet dependencies; CV XE and this project operate without Internet. The layers include U.S. by states, state by county, state by city/place, state by census tract. Select a State Click a state link to install and start using that state by neighborhood patterns GIS project.
Alabama
Alaska Arizona Arkansas California Colorado Connecticut Delaware District of Columbia Florida Georgia Hawaii Idaho Illinois Indiana Iowa Kansas Kentucky Louisiana Maine Maryland Massachusetts Michigan Minnesota Mississippi Missouri Montana Nebraska Nevada New Hampshire New Jersey New Mexico New York North Carolina North Dakota Ohio Oklahoma Oregon Pennsylvania Rhode Island South Carolina South Dakota Tennessee Texas Utah Vermont Virginia Washington West Virginia Wisconsin Wyoming Terms of Use Resources made available via this Web page are proprietary to ProximityOne. The resources may be used in any manner without further authorization except that none of the resources may be redistributed and none of the resources may be used with other software. Links to this page are encouraged as well as use of the data in stories and analyses. Any use of these resources is solely at the discretion of the user. There is no warranty or guarantee of any type. ProximityOne User Group Join the ProximityOne User Group to keep up-to-date with new developments relating to metros and component geography decision-making information resources. Receive updates and access to tools and resources available only to members. Use this form to join the User Group. Support Using these Resources Learn more about accessing and using demographic-economic data and related analytical tools. Join us in a Data Analytics Lab session. There is no fee for these one-hour Web sessions. Each informal session is focused on a specific topic. The open structure also provides for Q&A and discussion of application issues of interest to participants. Additional Information ProximityOne develops geodemographic-economic data and analytical tools and helps organizations knit together and use diverse data in a decision-making and analytical framework. We develop custom demographic/economic estimates and projections, develop geographic and geocoded address files, and assist with impact and geospatial analyses. Wide-ranging organizations use our tools (software, data, methodologies) to analyze their own data integrated with other data. Follow ProximityOne on Twitter at www.twitter.com/proximityone. Contact us (888-364-7656) with questions about data covered in this section or to discuss custom estimates, projections or analyses for your areas of interest. |
|
|