
|
|
|
Site Analysis API Tools
Use the ProximityOne SiteAnalysis tools to access all Census 2000 Summary File 3 (SF3), Census 2010 Summary File 1 (SF1) and each year American Community Survey 2010, 2011, 2012 block group level items tabulated. This feature is enabled though use of API technology. As a result, the SiteAnalysis tool, independent of site analysis operations, provides a map/visually-based data access and analytical tool for all block group level data from Census 2000 forward -- with no local storage or dataset manipulation required. Site analysis tools are computer-based operations that enable the user to examine demographic, economic and other characteristics of elemental geographies (such as block groups) as a group or composite. Typically, the group of elemental areas is defined by a circle or a radius value in miles from an address or location of interest ... a site with a 1-mile or a 3-mile radius, hence the term site analysis. A user might want to determine the size of population and housing attributes for a set of blocks/block groups within x miles of a location (site) and how this compares to the set of blocks/blocks groups within y miles of the same location. Similar applications/analyses might involve many locations, located in the same vicinity or anywhere (different regions). Another use for these tools is to answer questions such as "how far do I need to go from a location" to have an area that contains at least a minimum number of a specific population group. Three clinics serve children ages 5-17 ... how far away from each clinic do I need to go to have a population ages 5-17 of at least 1,000? How do the geographies of these areas compare. Does this explain why one clinic is more utilized than another? Are there better alternative clinic locations? How might the patterns compare with now and five years from now? 1- and 3-Mile Site Analysis Applications This view shows attributes of the population within a 1-mile radius (circular area selection) from a location. Cross-hatched areas are block groups intersecting with the 1-mile radius circle. The embedded table at right of map shows there are 17 block groups in this set with "D001" (ACS 2011 5 year total population) of 15,404 and "B01003_001" (ACS 2012 5 year total population) of 15,294. The D001 values are sourced from a local dataset (the shapefile dbf). The "B01003_001" values are sourced from the Internet/API.  . .
The next view shows results of expanding the circle to a 3-mile radius (circular area selection) from the location. Cross-hatched areas are block groups intersecting with the 3-mile radius circle. The embedded table at right of map shows there are 137 block groups in this set with "D001" value of 130,905 and B01003_001 value of 130,833.  . .
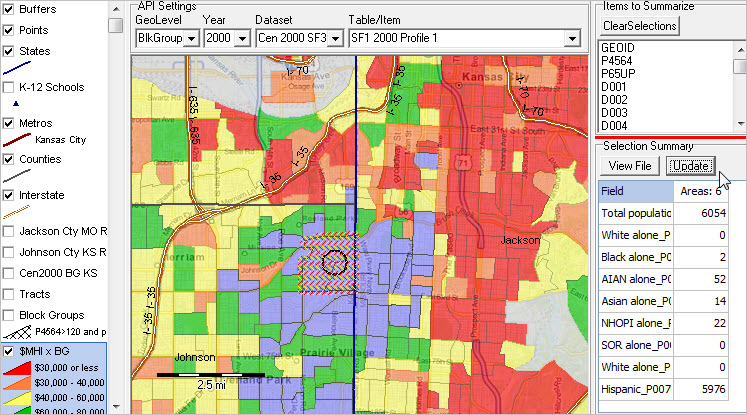
Site Analysis API This section is focused on using the CV XE GIS Site Analysis API (application programming interface) tools that enable access to wide-ranging, detailed demographic-economic data accessed over the Internet. The API tools enable the display and analysis of subject matter data via the Web alone or in combination with data stored locally. The power of these resources is embodied in the vast array of data accessible online without requiring locally stored data. Locating an Address or Block Group of Interest To locate an address of interest, use the SiteAnalysis Tools>Find Address or Tools>CodeAddresses. These features are described at locating addresses and coding address data. To locate a block group of interest, use the SiteAnlaysis Tools>FindShape operation. Site Analysis API Start-Up The graphic below shows the Site Analysis start-up view. The map view shows a thematic pattern of median household income by block group in the Kansas City area. The vertical line in the center of the view is the Missouri-Kansas state line. Block groups show colors/patterns of economic prosperity/ based on median household income. Colors/intervals for this layer, $MHI x BG, are shown at the bottom of the legend panel at left of the map view. Data are from American Community Survey 2011 5-year estimates.  . .
Steps to use the Site Analysis API application are summarized below. Install CV XE GIS on your Windows computer and follow these steps. Members of the ProximityOne User Group may use the no fee CV XE Site Analysis API Level 1 to perform these operations. Start CV XE GIS, select Tools>SiteAnalysis from the main menu and the GIS project shown above opens. 1. Selecting the layer and items for site analysis operation • Click the $MHI x BG layer name in legend panel. It turns blue indicating that is the "active layer". -- this shapefile dbf is populated with ACS 2011 5 year estimates. -- the "D" items are defined in the scroll section at http://proximityone.com/bgdata.htm. • When the active layer name is clicked (legend panel), the listbox at top right of map view populates. -- these are the fields available in the active layer shapefile dbf. • Dbl-click the field name GEOID, selecting the GEOID field as the unique string key field. -- the name appears in the statusbar confirming that field has been selected. • Multi-select the fields to be aggregated during the site analysis operation; they appear as blue highlighted. -- in this example select D001 (total population) and D002 (male population). • The settings are now ready to perform site analysis. 2. Define a site area using the mouse • multi-select 3 block groups as shown in the graphic below. • the mouse is used to select elemental geographies (block groups in this example). -- click the Select button in the toolbar below the main menu to set the mouse in this mode. • The operation of selecting geographies is to right click on an area or interest, then, holding the mouse key down, drag mouse forming a circle intersecting with the block groups to be selected, then release mouse button. Note that this could be only one elemental area -- a single block group. -- set the mouse mode to Zoom to zoom-in or out; set the mouse mode to Pan to drag map view; then return to Select mode; -- distance is shown by the scale bar in the map window.  . .
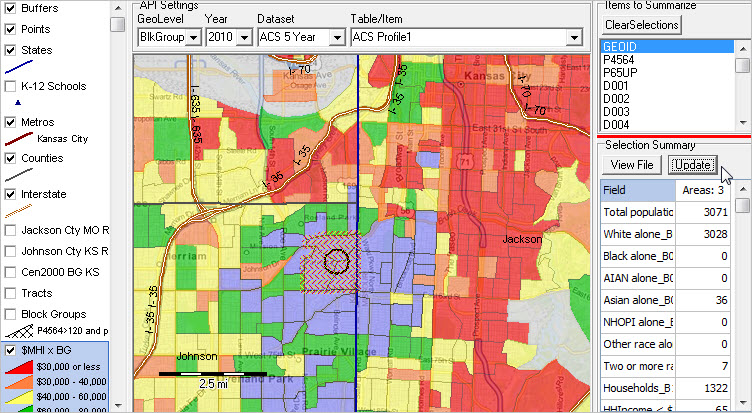
3. Using the API Settings panel • this initial example uses the default API Settings (above the map view). • change the API settings to access wide-ranging different data. • the graphic below illustrates options available in the Table/Item drop-down. • selecting "ACS Profile 1" provides a structured, multi-item profile. • the lower right grid ("Selection Summary") shows many items summarized for these 3 block groups. • more on changing these settings below.  . .
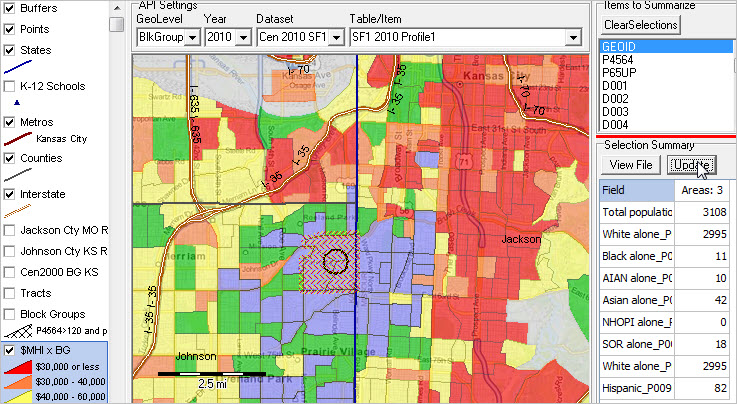
4. Viewing the results • the results are summarized in the Selection Summary section at lower right of map window. -- the grid shows two columns. Column 1 shows the field name for the data item. -- Column 2 shows the aggregated (summed over elemental areas) value for this selection of elemental areas • in this application data are summarized for two items selected from the local dataset and ACS Profile 1 items from the API (Web). • the Summary "says" these three block groups have total ACS 2011 5 year estimated population of 3,066, -- and total ACS 2012 5 year estimated total population of 3,092. 5. Saving the Results 5.1. Save/view the data shown in the grid using Excel. • the grid content is automatically copied to clipboard. • open Excel/spreadsheet tool and click/paste into cell A1:  . .
Click this link to view the XLS file. 5.2. Save/view the data records for each of the selected areas. • the selected records from the local dataset are stored in the file c:\cvxe\1\$$siterecs.dbf. -- click View File button in Selection Summary to open/view this file, as shown below. -- optional save (Copy To) CSV or TXT (fixed length fields) new file. -- this file is overwritten with each new site selection.  . .
6. Revised View of Same GeoSelection • optionally change the API Settings to view different data then click Update button in Selection Summary. -- redrawing a selection circle is not required. 7. Changing Selected Areas • selecting only one area; cherry picking areas. -- you may select only one area; keep the circle within that area (e.g. block group) • adding more areas to existing site selection. -- add more areas either with a larger circle that includes more areas -- or add a new circle that selects other areas -- multi-circle areas do not have to be contiguous. • setting a totally new selection. -- reply No to the prompt "Add to existing site?" 8. API Settings • the API Settings control what data are pulled from Internet. • see more on settings below. 9. GIS Project Management in Site Analysis • Layers can be added, deleted or modified to the Site Analysis project. • Modification to projects used in Site Analysis are not saved. • Modification to projects used in Site Analysis are made using from the main CV XE GIS form. -- for example, permanently adding or removing layers. 10. Exiting Site Analysis • Site Analysis is closed with no changes made to the associated GIS project. • Upon exiting Site Analysis, control is returned to the main CV XE GIS form. API Settings Section The API Settings are controlled by the API Setting section above the map window. 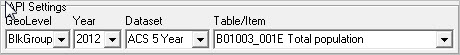 • the API Settings control what data are pulled from Internet. • see more on settings below. Examples (graphics): • Census 2000 Profile 1: click to view • Census 2010 Profile 1: click to view • ACS 2010 5 Year Profile 1: click to view Geographic Level • Only Census 2010 blocks and block groups are active for API access. Year • Select from 2000, 2010, 2011, 2012. Dataset • Select Census 2010 SF1, ACS 5 year or Census 2000 SF3. Table/Items Select from list. "B" items only for ACS "P" and "H" items only for Census 2000 and Census 2010 -- Census 2010 items are 8 character field names -- Census 2000 items are 7 character field names and listed invdropdown after Census 2010 items. Using Census 2000 Block Groups The $MHI x BG layer described above uses the Census 2010 block group codes and boundaries. All Census 2010 and ACS block group applications use Census 2010 block groups. When using applications involving Census 2000 data, a Census 2000 block group must be used. The CVXE_US2.GIS includes the Kansas Census 2000 block group file -- tl_2010_20_bg00.shp. There are no subject matter included in this layer/shapefile, but the file enables Census 2000 SF3 API access. To use geography other than Kansas requires adding those layers/shapefiles. Block Groups Used as Examples The three block groups used for illustration purposes is summarized below. Use the Identify tool (to left of Select tool) on toolbar above map window) to click on a block group and display a mini-profile. The mini profile attributes of the local shapefile dbase file tems. In this example, the three block groups have the following geocodes and Census 2010 SF1 and Census 2000 SF3 total population:
The sum of these areas are: Census 2000 SF3: 3,027, Census 2010 SF1 3,108, ACS 2012 5 Year: 3,092 ProximityOne User Group Join the ProximityOne User Group to keep up-to-date with new developments relating to geographic-demographic-economic decision-making information resources. Receive updates and access to tools and resources available only to members. Use this form to join the User Group. There is no fee. Support Using these Resources Learn more about site analysis, API data access applications and using these resources to examine custom defined study areas. Join us in a Decision-Making Information Web session. There is no fee for these one-hour Web sessions. Each informal session is focused on a specific topic. The open structure also provides for Q&A and discussion of application issues of interest to participants. Additional Information ProximityOne develops geographic-demographic-economic data and analytical tools and helps organizations knit together and use diverse data in a decision-making and analytical framework. We develop custom demographic/economic estimates and projections, develop geographic and geocoded address files, and assist with impact and geospatial analyses. Wide-ranging organizations use our tools (software, data, methodologies) to analyze their own data integrated with other data. Follow ProximityOne on Twitter at www.twitter.com/proximityone. Contact us (888-364-7656) with questions about data covered in this section or to discuss custom estimates, projections or analyses for your areas of interest. |
|
|