|
|
Block Group Demographic-Economic Profile Datasets
March 2017 Update. Block group level data described in this section are now available based on the more recent ACS 2015 data.
This section will soon be updated with the ACS 2015 data.
Site analysis using ACS 2012 block group demographic-economic data ...
block groups (BGs), subdivisions of census tracts, are the smallest geographic areas
for which "richer demographics" are developed by the Census Bureau. Block group demographic-economic estimates,
as defined using Census 2010 geography, are annually updated
beginning with American Community Survey (ACS) 2010.
The latest estimates for these 217,740 areas covering U.S. wall-to-wall, averaging 1,200 population, are from
ACS 2012.
This section illustrates how these data may be used to examine
custom defined geographic areas ... combinations of contiguous block groups forming or approximating corridors, traffic zones, school attendance zones,
neighborhoods, watersheds/environmental zones, site location study areas, among many others.
Using these Data. ProximityOne has developed several ACS 2012 national scope BG datasets.
From these datasets, the Block Group Demographic-Economic Profile dataset (50 million data points) has been derived.
We have integrated these data into the
U.S. block group shapefile for use in GIS and visual analysis applications. Additionally,
in CSV/Excel/dBase structure, the dataset make also be used with any application.
Using CV XE GIS,
these data can be used to create site analysis profiles such as the one shown below.
We also create study area profiles of this type for custom-defined areas as a service.
Contact us for details.
Application Example. The following thematic maps show how these data can be used to examine patterns of
economic prosperity based on median household income for Jackson County, MO, a part of the
Kansas City, MO-KS metro. Thematic maps showing many other types of demographic-economic patterns
could also be developed using this dataset. The sample comparative analysis profile presented below the maps shows a list of the more than 200
subject matter items for a study area shown in the second graphic.
Median Household Income by Block Group; Jackson County, MO
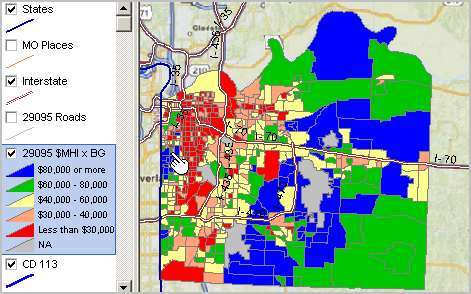
Zoom-in View ... see pointer in above view
Three block groups labeled: 29-095-007300-3, 29-095-007400-2, 29-095-007400-3
As shown in this view, block groups often comprise 10-15 city blocks - or fewer.
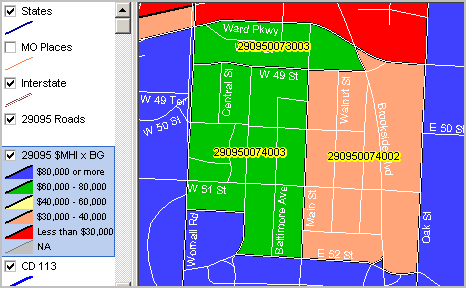
Comparative Analysis Block Group Demographic-Economic Profile (scroll section)
Block groups 29-095-007300-3, 29-095-007400-2, 29-095-007400-3 in above view
-- and summary for the custom-defined area
Profile generated with
CV XE GIS; available for any combination of block groups nationally.
| Geographic Area | 29-095-007300-3 | 29-095-007400-2 | 29-095-007400-3 | Summary |
| Description | Value | Percent | Value | Percent | Value | Percent | Value | Percent |
| d001 | Total Population by Gender & Age (B01001) | 946 | 100.00 | 792 | 100.00 | 865 | 100.00 | 2,603 | 100.0 |
| d002 | .. Male | 577 | 60.99 | 412 | 52.02 | 296 | 34.22 | 1,285 | 49.4 |
| d003 | .. Female | 369 | 39.01 | 380 | 47.98 | 569 | 65.78 | 1,318 | 50.6 |
| d004 | .. Under 5 years | 0 | 0.00 | 8 | 1.01 | 33 | 3.82 | 41 | 1.6 |
| d005 | .. 5 to 9 years | 0 | 0.00 | 0 | 0.00 | 0 | 0.00 | 0 | 0.0 |
| d006 | .. 10 to 14 years | 0 | 0.00 | 0 | 0.00 | 15 | 1.73 | 15 | 0.6 |
| d007 | .. 15 to 17 years | 0 | 0.00 | 0 | 0.00 | 0 | 0.00 | 0 | 0.0 |
| d008 | .. 18 and 19 years | 0 | 0.00 | 46 | 5.81 | 141 | 16.30 | 187 | 7.2 |
| d009 | .. 20 years | 0 | 0.00 | 94 | 11.87 | 0 | 0.00 | 94 | 3.6 |
| d010 | .. 21 years | 0 | 0.00 | 47 | 5.93 | 0 | 0.00 | 47 | 1.8 |
| d011 | .. 22 to 24 years | 94 | 9.94 | 148 | 18.69 | 73 | 8.44 | 315 | 12.1 |
| d012 | .. 25 to 29 years | 146 | 15.43 | 227 | 28.66 | 29 | 3.35 | 402 | 15.4 |
| d013 | .. 30 to 34 years | 98 | 10.36 | 42 | 5.30 | 108 | 12.49 | 248 | 9.5 |
| d014 | .. 35 to 39 years | 55 | 5.81 | 10 | 1.26 | 24 | 2.77 | 89 | 3.4 |
| d015 | .. 40 to 44 years | 58 | 6.13 | 43 | 5.43 | 29 | 3.35 | 130 | 5.0 |
| d016 | .. 45 to 49 years | 91 | 9.62 | 32 | 4.04 | 42 | 4.86 | 165 | 6.3 |
| d017 | .. 50 to 54 years | 88 | 9.30 | 3 | 0.38 | 117 | 13.53 | 208 | 8.0 |
| d018 | .. 55 to 59 years | 29 | 3.07 | 34 | 4.29 | 46 | 5.32 | 109 | 4.2 |
| d019 | .. 60 and 61 years | 9 | 0.95 | 0 | 0.00 | 16 | 1.85 | 25 | 1.0 |
| d020 | .. 62 to 64 years | 14 | 1.48 | 0 | 0.00 | 32 | 3.70 | 46 | 1.8 |
| d021 | .. 65 and 66 years | 10 | 1.06 | 35 | 4.42 | 36 | 4.16 | 81 | 3.1 |
| d022 | .. 67 to 69 years | 18 | 1.90 | 10 | 1.26 | 12 | 1.39 | 40 | 1.5 |
| d023 | .. 70 to 74 years | 88 | 9.30 | 0 | 0.00 | 30 | 3.47 | 118 | 4.5 |
| d024 | .. 75 to 79 years | 68 | 7.19 | 12 | 1.52 | 0 | 0.00 | 80 | 3.1 |
| d025 | .. 80 to 84 years | 36 | 3.81 | 0 | 0.00 | 46 | 5.32 | 82 | 3.2 |
| d026 | .. 85 years and over | 44 | 4.65 | 1 | 0.13 | 36 | 4.16 | 81 | 3.1 |
| d027 | .. Median age | 47.2 | ... | 26.6 | ... | 42.6 | ... | 38.8 | ... |
| Race (B02001) & Origin (B03003) | | | | | | | | |
| d028 | Total Population | 946 | 100.00 | 792 | 100.00 | 865 | 100.00 | 2,603 | 100.0 |
| d029 | .. White alone | 766 | 80.97 | 615 | 77.65 | 776 | 89.71 | 2,157 | 82.9 |
| d030 | .. Black or African American alone | 84 | 8.88 | 14 | 1.77 | 0 | 0.00 | 98 | 3.8 |
| d031 | .. American Indian and Alaska Native alone | 0 | 0.00 | 0 | 0.00 | 47 | 5.43 | 47 | 1.8 |
| d032 | .. Asian alone | 83 | 8.77 | 163 | 20.58 | 26 | 3.01 | 272 | 10.4 |
| d033 | .. Native Hawaiian & Other Pacific Islander alone | 0 | 0.00 | 0 | 0.00 | 0 | 0.00 | 0 | 0.0 |
| d034 | .. Some other race alone | 13 | 1.37 | 0 | 0.00 | 16 | 1.85 | 29 | 1.1 |
| d035 | .. Two or more races | 0 | 0.00 | 0 | 0.00 | 0 | 0.00 | 0 | 0.0 |
| d036 | .. Hispanic (B03003) | 13 | 1.37 | 9 | 1.14 | 78 | 9.02 | 100 | 3.8 |
| Households by Type (B11001) | | | | | | | | |
| d037 | Total Households | 748 | 100.00 | 440 | 100.00 | 499 | 100.00 | 1,687 | 100.0 |
| d038 | .. Family households | 172 | 22.99 | 45 | 10.23 | 184 | 36.87 | 401 | 23.8 |
| d039 | .... Married couple family | 163 | 21.79 | 45 | 10.23 | 135 | 27.05 | 343 | 20.3 |
| d040 | .... Other family | 9 | 1.20 | 0 | 0.00 | 49 | 9.82 | 58 | 3.4 |
| d041 | ...... Male householder, no wife present | 0 | 0.00 | 0 | 0.00 | 27 | 5.41 | 27 | 1.6 |
| d042 | ...... Female householder, no husband present | 9 | 1.20 | 0 | 0.00 | 22 | 4.41 | 31 | 1.8 |
| d043 | .. Nonfamily households | 576 | 77.01 | 395 | 89.77 | 315 | 63.13 | 1,286 | 76.2 |
| d044 | .... Householder living alone | 561 | 75.00 | 238 | 54.09 | 199 | 39.88 | 998 | 59.2 |
| d045 | .... Householder not living alone | 15 | 2.01 | 157 | 35.68 | 116 | 23.25 | 288 | 17.1 |
| d046 | Households with children under 18 years (B11005) | 0 | 0.00 | 8 | 1.82 | 42 | 8.42 | 50 | 3.0 |
| d047 | Households with persons 65 yrs or over (B11007) | 158 | 21.12 | 45 | 10.23 | 147 | 29.46 | 350 | 20.7 |
| d048 | Average Household Size (B25010/H012) | 1.26 | ... | 1.63 | ... | 1.73 | ... | 1.54 | ... |
| d049 | Average Household Size -- owner occupied | 1.47 | ... | 1.69 | ... | 1.50 | ... | 1.55 | ... |
| d050 | Average Household Size -- renter occupied | 1.10 | ... | 1.60 | ... | 1.88 | ... | 1.53 | ... |
| d050a | Population in Households (B11002/P029) | 946 | 100.00 | 718 | 90.66 | 865 | 100.00 | 2,529 | 97.2 |
| School Enrollment | | | | | | | | |
| d051 | Population 3 years and over | 946 | 100.00 | 784 | 100.00 | 845 | 100.00 | 2,575 | 100.0 |
| d052 | .. Enrolled in school: | 126 | 13.32 | 371 | 47.32 | 263 | 31.12 | 760 | 29.5 |
| d053 | .. Enrolled in nursery school, preschool | 0 | 0.00 | 0 | 0.00 | 13 | 1.54 | 13 | 0.5 |
| d054 | .... Public school | 0 | 0.00 | 0 | 0.00 | 0 | 0.00 | 0 | 0.0 |
| d055 | .... Private school | 0 | 0.00 | 0 | 0.00 | 13 | 1.54 | 13 | 0.5 |
| d056 | .. Enrolled in kindergarten: | 0 | 0.00 | 0 | 0.00 | 0 | 0.00 | 0 | 0.0 |
| d057 | .... Public school | 0 | 0.00 | 0 | 0.00 | 0 | 0.00 | 0 | 0.0 |
| d058 | .... Private school | 0 | 0.00 | 0 | 0.00 | 0 | 0.00 | 0 | 0.0 |
| d059 | .. Enrolled in grade 1 to grade 4: | 0 | 0.00 | 0 | 0.00 | 0 | 0.00 | 0 | 0.0 |
| d060 | .... Public school | 0 | 0.00 | 0 | 0.00 | 0 | 0.00 | 0 | 0.0 |
| d061 | .... Private school | 0 | 0.00 | 0 | 0.00 | 0 | 0.00 | 0 | 0.0 |
| d062 | .. Enrolled in grade 5 to grade 8: | 0 | 0.00 | 0 | 0.00 | 15 | 1.78 | 15 | 0.6 |
| d063 | .... Public school | 0 | 0.00 | 0 | 0.00 | 0 | 0.00 | 0 | 0.0 |
| d064 | .... Private school | 0 | 0.00 | 0 | 0.00 | 15 | 1.78 | 15 | 0.6 |
| d065 | .. Enrolled in grade 9 to grade 12: | 0 | 0.00 | 9 | 1.15 | 0 | 0.00 | 9 | 0.3 |
| d066 | .... Public school | 0 | 0.00 | 0 | 0.00 | 0 | 0.00 | 0 | 0.0 |
| d067 | .... Private school | 0 | 0.00 | 9 | 1.15 | 0 | 0.00 | 9 | 0.3 |
| d068 | .. Enrolled in college undergraduate | 98 | 10.36 | 138 | 17.60 | 150 | 17.75 | 386 | 15.0 |
| d069 | .... Public school | 98 | 10.36 | 53 | 6.76 | 9 | 1.07 | 160 | 6.2 |
| d070 | .... Private school | 0 | 0.00 | 85 | 10.84 | 141 | 16.69 | 226 | 8.8 |
| d071 | .. Enrolled in graduate or profession | 28 | 2.96 | 224 | 28.57 | 85 | 10.06 | 337 | 13.1 |
| d072 | .... Public school | 0 | 0.00 | 141 | 17.98 | 85 | 10.06 | 226 | 8.8 |
| d073 | .... Private school | 28 | 2.96 | 83 | 10.59 | 0 | 0.00 | 111 | 4.3 |
| d074 | .. Not enrolled in school | 820 | 86.68 | 413 | 52.68 | 582 | 68.88 | 1,815 | 70.5 |
| Educational Attainment (B15002) | | | | | | | | |
| d075 | Population 25 years and over | 852 | 100.00 | 449 | 100.00 | 603 | 100.00 | 1,904 | 100.0 |
| d076 | .. No schooling completed | 0 | 0.00 | 0 | 0.00 | 0 | 0.00 | 0 | 0.0 |
| d077 | .. Nursery to 4th Grade | 0 | 0.00 | 0 | 0.00 | 0 | 0.00 | 0 | 0.0 |
| d078 | .. 5th and 6th Grade | 0 | 0.00 | 0 | 0.00 | 0 | 0.00 | 0 | 0.0 |
| d079 | .. 7th and 8th Grade | 0 | 0.00 | 1 | 0.22 | 0 | 0.00 | 1 | 0.1 |
| d080 | .. 9th Grade | 0 | 0.00 | 0 | 0.00 | 7 | 1.16 | 7 | 0.4 |
| d081 | .. 10th Grade | 0 | 0.00 | 9 | 2.00 | 0 | 0.00 | 9 | 0.5 |
| d082 | .. 11th Grade | 0 | 0.00 | 0 | 0.00 | 0 | 0.00 | 0 | 0.0 |
| d083 | .. 12th, no diploma | 0 | 0.00 | 12 | 2.67 | 0 | 0.00 | 12 | 0.6 |
| d084 | .. High School Graduate, GED, or alternative | 51 | 5.99 | 16 | 3.56 | 78 | 12.94 | 145 | 7.6 |
| d085 | .. Some college, less than 1 year | 0 | 0.00 | 0 | 0.00 | 12 | 1.99 | 12 | 0.6 |
| d086 | .. Some college, 1 or more years, no degree | 108 | 12.68 | 95 | 21.16 | 99 | 16.42 | 302 | 15.9 |
| d087 | .. Associate's degree | 53 | 6.22 | 17 | 3.79 | 44 | 7.30 | 114 | 6.0 |
| d088 | .. Bachelor's degree | 283 | 33.22 | 121 | 26.95 | 121 | 20.07 | 525 | 27.6 |
| d089 | .. Master's degree | 222 | 26.06 | 145 | 32.29 | 158 | 26.20 | 525 | 27.6 |
| d090 | .. Professional school degree | 120 | 14.08 | 24 | 5.35 | 60 | 9.95 | 204 | 10.7 |
| d091 | .. Doctorate degree | 15 | 1.76 | 9 | 2.00 | 24 | 3.98 | 48 | 2.5 |
| Language Spoken at Home (B16004) | | | | | | | | |
| d092 | Population 5 years and over | 946 | 100.00 | 784 | 100.00 | 832 | 100.00 | 2,562 | 100.0 |
| d093 | .. Population 5 to 17 years: | 0 | 0.00 | 0 | 0.00 | 15 | 1.80 | 15 | 0.6 |
| d094 | .. Speak only English | 0 | 0.00 | 0 | 0.00 | 15 | 1.80 | 15 | 0.6 |
| d095 | .. Speak Spanish: | 0 | 0.00 | 0 | 0.00 | 0 | 0.00 | 0 | 0.0 |
| d096 | .... Speak English "not well" | 0 | 0.00 | 0 | 0.00 | 0 | 0.00 | 0 | 0.0 |
| d097 | .... Speak English "not at all" | 0 | 0.00 | 0 | 0.00 | 0 | 0.00 | 0 | 0.0 |
| d098 | .. Speak other Indo-European languages: | 0 | 0.00 | 0 | 0.00 | 0 | 0.00 | 0 | 0.0 |
| d099 | .... Speak English "not well" | 0 | 0.00 | 0 | 0.00 | 0 | 0.00 | 0 | 0.0 |
| d100 | .... Speak English "not at all" | 0 | 0.00 | 0 | 0.00 | 0 | 0.00 | 0 | 0.0 |
| d101 | .. Speak Asian and Pacific Island languages: | 0 | 0.00 | 0 | 0.00 | 0 | 0.00 | 0 | 0.0 |
| d102 | .... Speak English "not well" | 0 | 0.00 | 0 | 0.00 | 0 | 0.00 | 0 | 0.0 |
| d103 | .... Speak English "not at all" | 0 | 0.00 | 0 | 0.00 | 0 | 0.00 | 0 | 0.0 |
| d104 | .. Speak other languages: | 0 | 0.00 | 0 | 0.00 | 0 | 0.00 | 0 | 0.0 |
| d105 | .... Speak English "not well" | 0 | 0.00 | 0 | 0.00 | 0 | 0.00 | 0 | 0.0 |
| d106 | .... Speak English "not at all" | 0 | 0.00 | 0 | 0.00 | 0 | 0.00 | 0 | 0.0 |
| Household Income Past 12 Months (B19001) | | | | | | | | |
| d107 | Households | 748 | 100.00 | 440 | 100.00 | 499 | 100.00 | 1,687 | 100.0 |
| d108 | .. Less than $10,000 | 96 | 12.83 | 107 | 24.32 | 72 | 14.43 | 275 | 16.3 |
| d109 | .. $10,000 to $14,999 | 0 | 0.00 | 0 | 0.00 | 10 | 2.00 | 10 | 0.6 |
| d110 | .. $15,000 to $19,999 | 31 | 4.14 | 57 | 12.95 | 23 | 4.61 | 111 | 6.6 |
| d111 | .. $20,000 to $24,999 | 40 | 5.35 | 29 | 6.59 | 70 | 14.03 | 139 | 8.2 |
| d112 | .. $25,000 to $29,999 | 45 | 6.02 | 9 | 2.05 | 0 | 0.00 | 54 | 3.2 |
| d113 | .. $30,000 to $34,999 | 72 | 9.63 | 0 | 0.00 | 25 | 5.01 | 97 | 5.7 |
| d114 | .. $35,000 to $39,999 | 0 | 0.00 | 30 | 6.82 | 0 | 0.00 | 30 | 1.8 |
| d115 | .. $40,000 to $44,999 | 11 | 1.47 | 0 | 0.00 | 17 | 3.41 | 28 | 1.7 |
| d116 | .. $45,000 to $49,999 | 15 | 2.01 | 37 | 8.41 | 10 | 2.00 | 62 | 3.7 |
| d117 | .. $50,000 to $59,999 | 30 | 4.01 | 27 | 6.14 | 14 | 2.81 | 71 | 4.2 |
| d118 | .. $60,000 to $74,999 | 56 | 7.49 | 36 | 8.18 | 63 | 12.63 | 155 | 9.2 |
| d119 | .. $75,000 to $99,999 | 40 | 5.35 | 52 | 11.82 | 0 | 0.00 | 92 | 5.5 |
| d120 | .. $100,000 to $124,999 | 9 | 1.20 | 21 | 4.77 | 20 | 4.01 | 50 | 3.0 |
| d121 | .. $125,000 to $149,999 | 58 | 7.75 | 0 | 0.00 | 47 | 9.42 | 105 | 6.2 |
| d122 | .. $150,000 to $199,999 | 84 | 11.23 | 18 | 4.09 | 8 | 1.60 | 110 | 6.5 |
| d123 | .. $200,000 or more | 161 | 21.52 | 17 | 3.86 | 120 | 24.05 | 298 | 17.7 |
| d124 | .. Median Household Income (B19003) | 73,333 | ... | 37,045 | ... | 60,817 | ... | 57,065 | |
| Other Income and Poverty Measures | | | | | | | | |
| d125 | .. Median Family Income (B19113) | 156,023 | ... | 74,896 | ... | 69,500 | ... | 100,140 | |
| d126 | .. Per Capita Income (B19301) | 91,290 | ... | 30,769 | ... | 82,077 | ... | 68,045 | |
| d127 | .. All families (B17010) | 172 | 100.00 | 45 | 100.00 | 184 | 100.00 | 401 | 100.0 |
| d128 | .... With income past 12 months below poverty leve | 0 | 0.00 | 0 | 0.00 | 32 | 17.39 | 32 | 8.0 |
| d129 | ...... Married-couple family (in poverty) | 0 | 0.00 | 0 | 0.00 | 10 | 5.43 | 10 | 2.5 |
| d130 | ........ With related children under 18 yrs | 0 | 0.00 | 0 | 0.00 | 0 | 0.00 | 0 | 0.0 |
| Employment Status (B23025) | | | | | | | | |
| d133 | Population 16 years and over | 946 | 100.00 | 784 | 100.00 | 817 | 100.00 | 2,547 | 100.0 |
| d134 | .. In labor force | 702 | 74.21 | 585 | 74.62 | 603 | 73.81 | 1,890 | 74.2 |
| d135 | .... In Armed Forces | 0 | 0.00 | 0 | 0.00 | 0 | 0.00 | 0 | 0.0 |
| d136 | .... Civilian | 702 | 74.21 | 585 | 74.62 | 603 | 73.81 | 1,890 | 74.2 |
| d137 | ...... Employed | 579 | 61.21 | 573 | 73.09 | 480 | 58.75 | 1,632 | 64.1 |
| d138 | ...... Unemployed | 123 | 13.00 | 12 | 1.53 | 123 | 15.06 | 258 | 10.1 |
| d139 | .. Not in labor force | 244 | 25.79 | 199 | 25.38 | 214 | 26.19 | 657 | 25.8 |
| d140 | Housing Units (B25001) | 828 | 100.00 | 531 | 100.00 | 567 | 100.00 | 1,926 | |
| d141 | .. Occupied housing units | 748 | 90.34 | 440 | 82.86 | 499 | 88.01 | 1,687 | 87.6 |
| d142 | .... Owner-occupied housing units | 327 | 39.49 | 173 | 32.58 | 195 | 34.39 | 695 | 36.1 |
| d143 | .... Renter-occupied housing units | 421 | 50.85 | 267 | 50.28 | 304 | 53.62 | 992 | 51.5 |
| d144 | .. Vacant housing units | 80 | 9.66 | 91 | 17.14 | 68 | 11.99 | 239 | 12.4 |
| d145 | .... For Rent | 0 | 0.00 | 91 | 17.14 | 0 | 0.00 | 91 | 4.7 |
| d146 | .... For seasonal, recreational, occasional use | 41 | 4.95 | 0 | 0.00 | 0 | 0.00 | 41 | 2.1 |
| Units in Structure (B25024) | | | | | | | | 0.0 |
| d147 | Total Housing Units | 828 | 100.00 | 531 | 100.00 | 567 | 100.00 | 1,926 | 100.0 |
| d148 | .. 1, detached | 23 | 2.78 | 96 | 18.08 | 39 | 6.88 | 158 | 8.2 |
| d149 | .. 1, attached | 49 | 5.92 | 12 | 2.26 | 15 | 2.65 | 76 | 3.9 |
| d150 | .. 2 | 12 | 1.45 | 20 | 3.77 | 0 | 0.00 | 32 | 1.7 |
| d151 | .. 3 or 4 | 0 | 0.00 | 171 | 32.20 | 130 | 22.93 | 301 | 15.6 |
| d152 | .. 5 to 9 | 0 | 0.00 | 46 | 8.66 | 110 | 19.40 | 156 | 8.1 |
| d153 | .. 10 to 19 | 0 | 0.00 | 83 | 15.63 | 45 | 7.94 | 128 | 6.6 |
| d154 | .. 20 to 49 | 94 | 11.35 | 78 | 14.69 | 111 | 19.58 | 283 | 14.7 |
| d155 | .. 50 or more | 650 | 78.50 | 25 | 4.71 | 117 | 20.63 | 792 | 41.1 |
| d156 | .. Mobile home | 0 | 0.00 | 0 | 0.00 | 0 | 0.00 | 0 | 0.0 |
| d157 | .. Boat, RV, van, etc. | 0 | 0.00 | 0 | 0.00 | 0 | 0.00 | 0 | 0.0 |
| Year Structure Built (B25024) | | | | | | | | |
| d158 | Total Housing Units | 828 | 100.00 | 531 | 100.00 | 567 | 100.00 | 1,926 | 100.0 |
| d159 | .. Built 2005 or later | 10 | 1.21 | 14 | 2.64 | 112 | 19.75 | 136 | 7.1 |
| d160 | .. Built 2000 to 2004 | 0 | 0.00 | 0 | 0.00 | 96 | 16.93 | 96 | 5.0 |
| d161 | .. Built 1990 to 1999 | 9 | 1.09 | 8 | 1.51 | 11 | 1.94 | 28 | 1.5 |
| d162 | .. Built 1980 to 1989 | 15 | 1.81 | 39 | 7.34 | 0 | 0.00 | 54 | 2.8 |
| d163 | .. Built 1970 to 1979 | 86 | 10.39 | 93 | 17.51 | 16 | 2.82 | 195 | 10.1 |
| d164 | .. Built 1960 to 1969 | 187 | 22.58 | 95 | 17.89 | 62 | 10.93 | 344 | 17.9 |
| d165 | .. Built 1950 to 1959 | 53 | 6.40 | 8 | 1.51 | 48 | 8.47 | 109 | 5.7 |
| d166 | .. Built 1940 to 1949 | 41 | 4.95 | 55 | 10.36 | 19 | 3.35 | 115 | 6.0 |
| d167 | .. Built 1939 or earlier | 427 | 51.57 | 219 | 41.24 | 203 | 35.80 | 849 | 44.1 |
| d168 | Median Year Structure Built | 1,939 | ... | 1,948 | ... | 1,962 | ... | 1,950 | |
| Value (B25075) | | | | | | | | |
| d169 | Owner-Occupied Housing Units | 327 | 100.00 | 173 | 100.00 | 195 | 100.00 | 695 | 100.0 |
| d170 | .. Less than $10,000 | 0 | 0.00 | 0 | 0.00 | 0 | 0.00 | 0 | 0.0 |
| d171 | .. $10,000 to $14,999 | 0 | 0.00 | 0 | 0.00 | 0 | 0.00 | 0 | 0.0 |
| d172 | .. $15,000 to $19,999 | 0 | 0.00 | 0 | 0.00 | 0 | 0.00 | 0 | 0.0 |
| d173 | .. $20,000 to $24,999 | 0 | 0.00 | 0 | 0.00 | 0 | 0.00 | 0 | 0.0 |
| d174 | .. $25,000 to $29,999 | 0 | 0.00 | 0 | 0.00 | 0 | 0.00 | 0 | 0.0 |
| d175 | .. $30,000 to $34,999 | 0 | 0.00 | 0 | 0.00 | 0 | 0.00 | 0 | 0.0 |
| d176 | .. $35,000 to $39,999 | 0 | 0.00 | 0 | 0.00 | 0 | 0.00 | 0 | 0.0 |
| d177 | .. $40,000 to $49,999 | 0 | 0.00 | 0 | 0.00 | 0 | 0.00 | 0 | 0.0 |
| d178 | .. $50,000 to $59,999 | 0 | 0.00 | 0 | 0.00 | 0 | 0.00 | 0 | 0.0 |
| d179 | .. $60,000 to $69,999 | 0 | 0.00 | 0 | 0.00 | 0 | 0.00 | 0 | 0.0 |
| d180 | .. $70,000 to $79,999 | 0 | 0.00 | 0 | 0.00 | 0 | 0.00 | 0 | 0.0 |
| d181 | .. $80,000 to $89,999 | 0 | 0.00 | 0 | 0.00 | 0 | 0.00 | 0 | 0.0 |
| d182 | .. $90,000 to $99,999 | 0 | 0.00 | 11 | 6.36 | 0 | 0.00 | 11 | 1.6 |
| d183 | .. $100,000 to $124,999 | 9 | 2.75 | 14 | 8.09 | 15 | 7.69 | 38 | 5.5 |
| d184 | .. $125,000 to $149,999 | 0 | 0.00 | 32 | 18.50 | 11 | 5.64 | 43 | 6.2 |
| d185 | .. $150,000 to $174,999 | 0 | 0.00 | 21 | 12.14 | 0 | 0.00 | 21 | 3.0 |
| d186 | .. $175,000 to $199,999 | 15 | 4.59 | 0 | 0.00 | 23 | 11.79 | 38 | 5.5 |
| d187 | .. $200,000 to $249,999 | 62 | 18.96 | 25 | 14.45 | 26 | 13.33 | 113 | 16.3 |
| d188 | .. $250,000 to $299,999 | 44 | 13.46 | 0 | 0.00 | 0 | 0.00 | 44 | 6.3 |
| d189 | .. $300,000 to $399,999 | 81 | 24.77 | 27 | 15.61 | 8 | 4.10 | 116 | 16.7 |
| d190 | .. $400,000 to $499,999 | 24 | 7.34 | 31 | 17.92 | 0 | 0.00 | 55 | 7.9 |
| d191 | .. $500,000 to $749,999 | 27 | 8.26 | 12 | 6.94 | 75 | 38.46 | 114 | 16.4 |
| d192 | .. $750,000 to $999,999 | 52 | 15.90 | 0 | 0.00 | 12 | 6.15 | 64 | 9.2 |
| d193 | .. $1,000,000 or more | 13 | 3.98 | 0 | 0.00 | 25 | 12.82 | 38 | 5.5 |
| d194 | Median Housing Value (owner-occupied units) | 341,400 | ... | 217,000 | ... | 548,300 | ... | 368,900 | |
| Gross Rent (B25063) | | | | | | | | |
| d195 | Renter-Occupied Housing Units | 421 | 100.00 | 267 | 100.00 | 304 | 100.00 | 992 | 100.0 |
| d196 | With Cash Rent | 388 | 92.16 | 253 | 94.76 | 304 | 100.00 | 945 | 95.3 |
| d197 | .. Less than $100 | 0 | 0.00 | 0 | 0.00 | 0 | 0.00 | 0 | 0.0 |
| d198 | .. $100 to $149 | 0 | 0.00 | 0 | 0.00 | 0 | 0.00 | 0 | 0.0 |
| d199 | .. $150 to $199 | 12 | 2.85 | 0 | 0.00 | 0 | 0.00 | 12 | 1.2 |
| d200 | .. $200 to $249 | 0 | 0.00 | 0 | 0.00 | 0 | 0.00 | 0 | 0.0 |
| d201 | .. $250 to $299 | 0 | 0.00 | 0 | 0.00 | 0 | 0.00 | 0 | 0.0 |
| d202 | .. $300 to $349 | 0 | 0.00 | 0 | 0.00 | 0 | 0.00 | 0 | 0.0 |
| d203 | .. $350 to $399 | 0 | 0.00 | 0 | 0.00 | 0 | 0.00 | 0 | 0.0 |
| d204 | .. $400 to $449 | 0 | 0.00 | 0 | 0.00 | 0 | 0.00 | 0 | 0.0 |
| d205 | .. $450 to $499 | 0 | 0.00 | 10 | 3.75 | 0 | 0.00 | 10 | 1.0 |
| d206 | .. $500 to $549 | 0 | 0.00 | 64 | 23.97 | 0 | 0.00 | 64 | 6.5 |
| d207 | .. $550 to $599 | 110 | 26.13 | 0 | 0.00 | 44 | 14.47 | 154 | 15.5 |
| d208 | .. $600 to $649 | 39 | 9.26 | 8 | 3.00 | 8 | 2.63 | 55 | 5.5 |
| d209 | .. $650 to $699 | 27 | 6.41 | 35 | 13.11 | 9 | 2.96 | 71 | 7.2 |
| d210 | .. $700 to $749 | 112 | 26.60 | 0 | 0.00 | 21 | 6.91 | 133 | 13.4 |
| d211 | .. $750 to $799 | 9 | 2.14 | 16 | 5.99 | 31 | 10.20 | 56 | 5.6 |
| d212 | .. $800 to $899 | 15 | 3.56 | 40 | 14.98 | 88 | 28.95 | 143 | 14.4 |
| d213 | .. $900 to $999 | 0 | 0.00 | 17 | 6.37 | 36 | 11.84 | 53 | 5.3 |
| d214 | .. $1,000 to $1,249 | 27 | 6.41 | 43 | 16.10 | 10 | 3.29 | 80 | 8.1 |
| d215 | .. $1,250 to $1,499 | 26 | 6.18 | 20 | 7.49 | 7 | 2.30 | 53 | 5.3 |
| d216 | .. $1,500 to $1,999 | 0 | 0.00 | 0 | 0.00 | 0 | 0.00 | 0 | 0.0 |
| d217 | .. $2,000 or more | 11 | 2.61 | 0 | 0.00 | 50 | 16.45 | 61 | 6.1 |
| d218 | No Cash Rent | 33 | 7.84 | 14 | 5.24 | 0 | 0.00 | 47 | 4.7 |
| d219 | Median Gross Rent (renter-occupied; cash rent) | 703 | ... | 780 | ... | 844 | ... | 776 | |
Support Using these Resources [goto top]
Learn more about demographic economic data and related analytical tools.
Join us in a Data Analytics Lab session.
There is no fee for these Web sessions.
Each informal session is focused on a specific topic.
The open structure also provides for Q&A and discussion of application issues of interest to participants.
ProximityOne User Group [goto top]
Join the ProximityOne User Group
to keep up-to-date with new developments relating to geographic-demographic-economic decision-making information resources.
Receive updates and access to tools and resources available only to members.
Use this form to join the User Group.
Additional Information
ProximityOne develops geodemographic-economic data and analytical tools and helps organizations knit together and use diverse data in a decision-making and analytical framework. We develop custom demographic/economic estimates and projections, develop geographic and geocoded address files, and assist with impact and geospatial analyses.
Wide-ranging organizations use our tools (software, data, methodologies) to analyze their own data integrated with other data.
Follow ProximityOne on Twitter at www.twitter.com/proximityone.
Contact us (888-364-7656) with questions about data covered in this section or to discuss
custom estimates, projections or analyses for your areas of interest.
|
