
|
|
|
Principal Cities of Metropolitan Areas
Principal cities of metros are the main core cities in each metropolitan area. The largest city in each metropolitan or micropolitan statistical area is designated a "principal city." Additional cities qualify if specified requirements are met concerning population size and employment. The title of each metropolitan or micropolitan statistical area consists of the names of up to three of its principal cities and the name of each state into which the metropolitan or micropolitan statistical area extends. See details. Based on the latest 2013 vintage CBSA definitions, there are 1,233 principal cities in the U.S. Designation as a principal city is not an indicator of size although all larger cities are principal cities. Principal cities range in population from Logan city, WV (2,015) to New York city, NY (8,199,221) (ACS 2012 5-year estimates). The total population of the 1,233 principal cities was 108,883,864 (35.2% of total 309,138,711 U.S. population). Demographic-Economic Characteristics of Principal Cities Examine characteristics of principal cities using these U.S. national scope City-Place Demographic-Economic interactive tables: • General Demographics • Social Characteristics • Economic Characteristics • Housing Characteristics Use interactive ranking tables in the above sections to view, query, rank, compare characteristics of principal cities and/or all U.S. cities. To view characteristics of principal cities, click the "PrincipalCities" button below the interactive table. Visual Analysis of Principal Cities in Selected Metros -- scroll section The scroll section below shows illustrative map views for the principal cities in selected metros: ... Atlanta ... Dallas ... Des Moines ... Houston ... Kansas City ... Phoenix ... San Jose ... Washington
Atlanta, GA MSA Principal Cities

Dallas, TX MSA Principal Cities 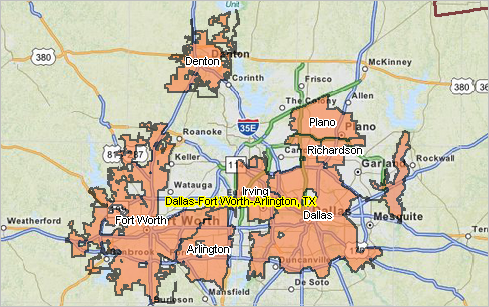
Des Moines, IA MSA Principal Cities 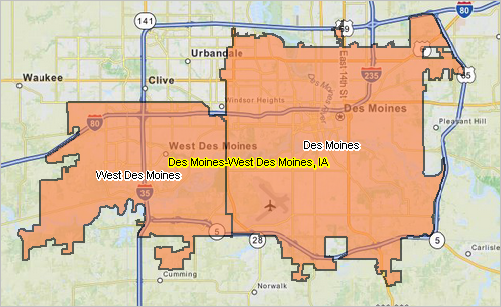
Houston, TX MSA Principal Cities 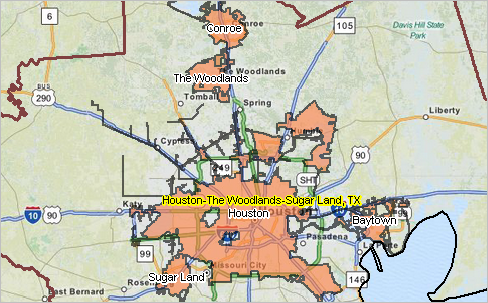
Kansas City, MO-KS MSA Principal Cities 
Phoenix, AZ MSA Principal Cities 
San Jose, CA MSA Principal Cities 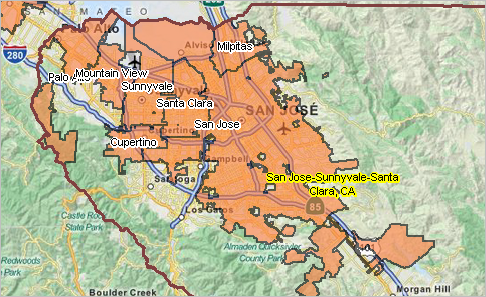
Washington, DC-VA-MD MSA Principal Cities 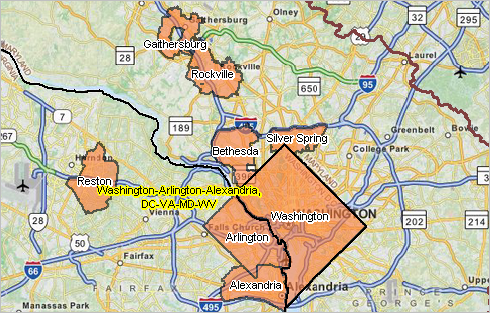
Join the ProximityOne User Group to use this GIS project; add your own data; change colors, labeling, subject matter (join now, no fee). Using the Interactive Tables An example of examining educational attainment for principal cities in a selected metro (Houston, TX) follows. • Open Social Characteristics Table • Key in "26420" (no quotes) below the table in box at right of Find CBSA; next click the Find CBSA button. - 26420 is the Houston CBSA code, find others as described below the table. - the table refreshes showing only the 5 Houston principal cities. • Use the horizontal scroll bar to navigate the columns to the right so that column header S067 appears. - the view appears as shown below. 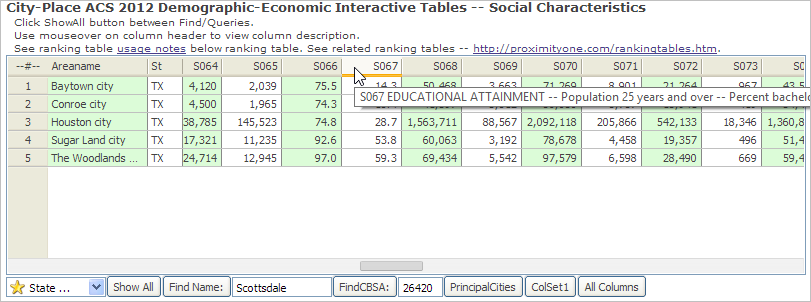 • Dbl-click the header cell S067 to rank descending on this item. The table now appears as shown below - the view appears as shown below. 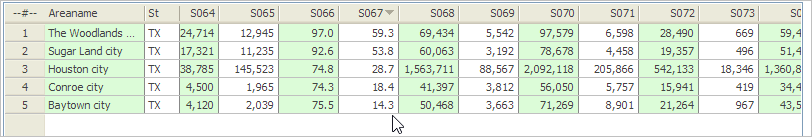 Insights ... educational attainment, percent bachelor's degree or higher varies widely among these cities. The Woodlands at 59.3% to Baytown at 14.3%; see Houston metro principal cities map above. Click ShowAll button and try a metro of interest. About Principal Cities The largest city in each metropolitan or micropolitan statistical area is designated a "principal city." Additional cities qualify if specified requirements are met concerning population size and employment. The title of each metropolitan or micropolitan statistical area consists of the names of up to three of its principal cities and the name of each state into which the metropolitan or micropolitan statistical area extends. The U.S. Office of Management and Budget (OMB) delineates metropolitan and micropolitan statistical areas according to standards applied to Census Bureau data. A metropolitan or micropolitan statistical area has a core area containing a substantial population nucleus, together with adjacent areas having a high degree of economic and social integration with that core. Current vintage metropolitan and micropolitan statistical area designations were announced effective February 2013. The term "core based statistical area" (CBSA) refers collectively to metropolitan and micropolitan statistical areas. Each CBSA must contain at least one urban area of 10,000 or more population. Each metropolitan statistical area must have at least one urbanized area of 50,000 or more inhabitants. Each micropolitan statistical area must have at least one urban cluster of at least 10,000 but less than 50,000 population. Additional Information ProximityOne develops geographic-demographic-economic data and analytical tools and helps organizations knit together and use diverse data in a decision-making and analytical framework. We develop custom demographic/economic estimates and projections, develop geographic and geocoded address files, and assist with impact and geospatial analyses. Wide-ranging organizations use our tools (software, data, methodologies) to analyze their own data integrated with other data. Follow ProximityOne on Twitter at www.twitter.com/proximityone. Contact us (888-364-7656) with questions about data covered in this section or to discuss custom estimates, projections or analyses for your areas of interest. |
|
|