
|
|
|
Characteristics of Largest 50 U.S. Metropolitan Areas
January 2016. The total population of the largest 50 U.S. metropolitan areas as of 2014 (latest official estimates) was 174,886,265. These 50 metros account for 58.3% of the population in all 917 metropolitan areas and 54.8% of the total U.S. population. By either measure, more than half of the U.S. population resides in these 50 metros. Use tools and data resources described in this section to view and analyze these metros. View the list of these metros by population rank in the scroll section provided below. Click on a metro link to view the Metro Situation & Outlook Report for that metro. The report provides extensive details on the geographic-demographic-economic attributes of the metro. Use the largest_50_metros GIS project described in this section to map and explore characteristics of these metros. Create zoom-in views of metros/regions of interest. Label geography. Add other geography and data. The largest_50_metros GIS project/datasets includes all U.S. metros and has been used to develop the views in this section: • View 1 .. 50 Largest Metros Ranked on 2014 Total Population • View 2 .. All Metropolitan & Micropolitan Statistical Areas • View 3 .. Patterns of Percent Population Change 2010-2014 See details about using the largest_50_metros GIS project below in this section. 50 Largest Metros Ranked on 2014 Total Population The following graphic shows the 50 largest metros by 2014 population rank (blue metros are the largest 10). Click graphic for larger view, more detail and legend color/data intervals (expand browser window for best view).  - View developed using CV XE GIS and related GIS project. All Metropolitan & Micropolitan Statistical Areas The following graphic shows all metropolitan statistical areas (blue) and micropolitan statistical areas (orange). Click graphic for larger view, more detail and legend color/data intervals (expand browser window for best view). 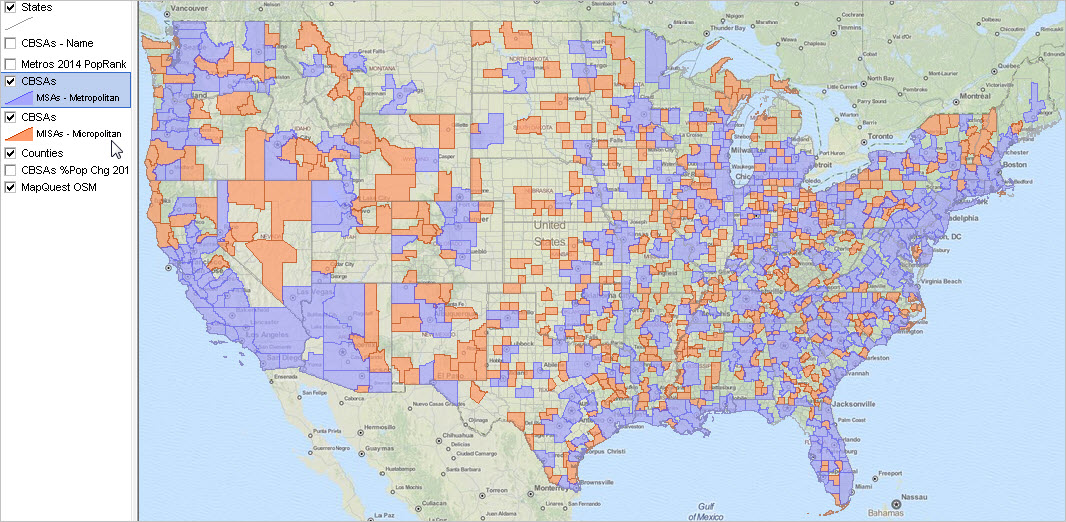 - View developed using CV XE GIS and related GIS project. Patterns of Percent Population Change 2010-2014 The following graphic shows the percent change in total population from 2010 to 2014 for all metros. Click graphic for larger view, more detail and legend color/data intervals (expand browser window for best view). This map illustrates the relative ease to gain insights into patterns of population change using geospatial data analytics tools. 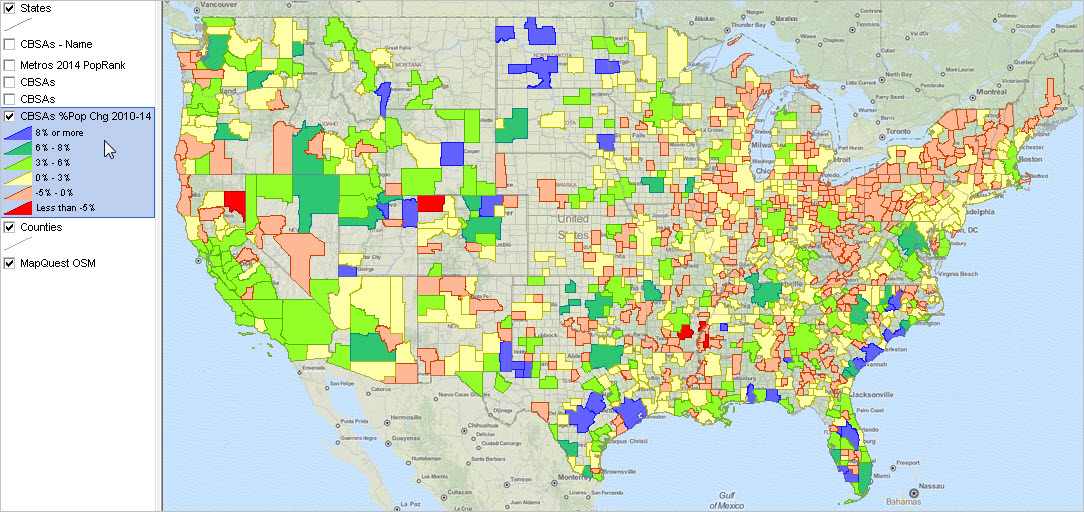 - View developed using CV XE GIS and related GIS project. 50 Largest Metros Ranked on 2014 Total Population -- scroll section Click link to view Metro Situation & Outlook Report
Largest 50 Metros GIS Project/Datasets 1. Install the ProximityOne CV XE GIS ... omit this step if CV XE GIS software already installed. ... run the CV XE GIS installer ... take all defaults during installation 2. Download the Largest 50 Metros GIS project fileset ... requires ProximityOne User Group ID (join now) ... unzip Largest 50 Metros GIS project files to local folder c:\largest_metros 3. Open the large_50_metros1.gis project ... after completing the above steps, click File>Open>Dialog ... open the file named c:\largest_metros\largest_50_metros1.gis 4. Done .. the start-up view is similar to the graphic shown at the top of this section. ProximityOne User Group Join the ProximityOne User Group to keep up-to-date with new developments relating to metros and component geography decision-making information resources. Receive updates and access to tools and resources available only to members. Use this form to join the User Group. Support Using these Resources Learn more about accessing and using demographic-economic data and related analytical tools. Join us in a Data Analytics Lab session. There is no fee for these one-hour Web sessions. Each informal session is focused on a specific topic. The open structure also provides for Q&A and discussion of application issues of interest to participants. Additional Information ProximityOne develops geodemographic-economic data and analytical tools and helps organizations knit together and use diverse data in a decision-making and analytical framework. We develop custom demographic/economic estimates and projections, develop geographic and geocoded address files, and assist with impact and geospatial analyses. Wide-ranging organizations use our tools (software, data, methodologies) to analyze their own data integrated with other data. Follow ProximityOne on Twitter at www.twitter.com/proximityone. Contact us (888-364-7656) with questions about data covered in this section or to discuss custom estimates, projections or analyses for your areas of interest. |
|
|