
|
|
|
-- updates to 2013 metropolitan statistical area designations New metropolitan area designations are important; they identify transitioning and growing counties reaching a certain plateau of demographic-economic well-being. In July 2015, sixteen new Micropolitan Statistical Areas (MISAs) were designated, reflecting population growth through 2014. At the same time one MISA changed status to a Metropolitan Statistical Area (MSA) -- Enid, OK. The five new Combined Statistical Areas (CSAs) reflect continuing urban agglomeration evolvement as contiguous metros grow and join adjacent metros. How will these new metros change by 2020? 2060? relate to others? .. insights using our projections and modeling tools. Core-Based Statistical Areas (CBSAs -- the collective set of MSAs and MISAs) designations are updated from periodically based on changing demographic-economic conditions. The July 2015 CBSA designations, summarized here, update the previous February 2013 CBSA designations. CBSAs are comprised of one or more contiguous counties. CBSA designations are made by OMB based primarily on Census Bureau data. There are now 945 CBSAs (MSAs and MISAs) in the U.S. and Puerto Rico. • 389 MSAs (382 in the United States and 7 in Puerto Rico). .. 11 MSAs contain a total of 31 Metropolitan Divisions (MDs). • 556 MISAs (551 in the U.S. and 5 in Puerto Rico). 174 Combined Statistical Areas (CSAs) now exist with a total of 537 component MSAs and MISAs. Updates provided here are based on 2010 standards for delineating MSAs and MISAs. The updates reflect changes based on Census Bureau population estimates for July 1, 2012 and July 1, 2013. The 2015 changes include: • designation of a new metropolitan statistical area • sixteen new micropolitan statistical areas • five new combined statistical areas • new components of existing combined statistical areas • other changes 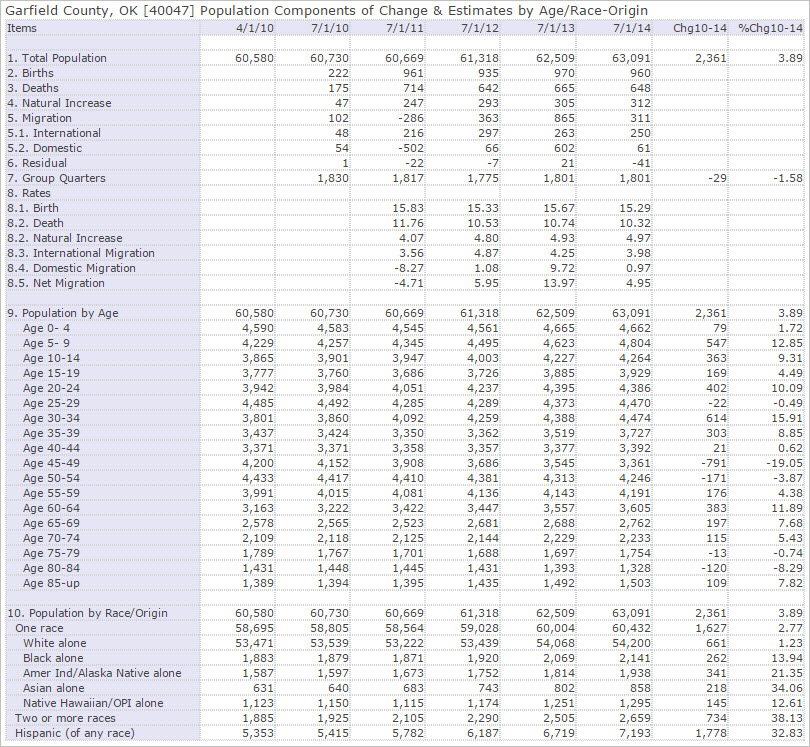 Examining Demographic Change for Metros & Components
In the list that follows, the MSA or MISA 5-digit geocode/geoid, uniquely identifying this metro/CBSA among all others, appears following the MSA or MISA name. Click county code link, following county name, to view a demographic trend profile. Click graphic at right to view the illustrative profile for Garfield County, OK (Enid, OK MSA). View county demographic change in context of other counties using this interactive table. View characteristics of principal cities in context of other cities using this interactive table. New Metropolitan Statistical Areas -- Principal Cities and County Components Enid, OK MSA (21420) -- previously a MISA that now qualifies as a new MSA Principal City: Enid Garfield County (40047) New Micropolitan Statistical Areas (MISA) top -- Principal Cities and County Components Alexander City, AL MISA (10760) Principal City: Alexander City Tallapoosa County (01123) Atmore, AL MISA (12120) Principal City: Atmore Escambia County (12033) Bonham, TX MISA (14300) Principal City: Bonham Fannin County (48147) Brownsville, TN MISA (15140) Principal City: Brownsville Haywood County (47075) Carroll, IA MISA (16140) Principal City: Carroll Carroll County (19027) Central City, KY MISA (16420) Principal City: Central City Muhlenberg County (21177) Eufaula, AL-GA MISA (21640) Principal City: Eufaula, AL Barbour County, AL (01005); Quitman County, GA (13239) Fairmont, MN (21860 MISA) Principal City: Fairmont Martin County (27091) Fort Payne, AL MISA (22840) Principal City: Fort Payne DeKalb County (01049) Grand Rapids, MN MISA (24330) Principal City: Grand Rapids Itasca County (27061) Hope, AR MISA (26260) Principal City: Hope Hempstead County, (05057) Nevada County (05099) Jennings, LA MISA (27660) Principal City: Jennings Jefferson Davis Parish (22053) Pella, IA MISA (37800) Principal City: Pella Marion County (19125) Ruidoso, NM MISA (40760) Principal City: Ruidoso Lincoln County (35027) St. Marys, PA MISA (41260) Principal City: St. Marys Elk County (42047) West Point, MS MISA (48500) Principal City: West Point Clay County (28025) New Combined Statistical Areas (CSA) and Components top Columbus-West Point, MS CSA (200) Columbus, MS MISA West Point, MS MISA Jackson-Brownsville, TN CSA (297) Brownsville, TN MISA Jackson, TN MSA Lake Charles-Jennings, LA CSA (324) Jennings, LA MISA Lake Charles, LA MSA Oskaloosa-Pella, IA CSA (423) Oskaloosa, IA MISA Pella, IA MISA Pensacola-Ferry Pass, FL-AL CSA (426) Atmore, AL MISA Pensacola-Ferry Pass-Brent, FL MSA New Components of Existing Combined Statistical Areas (CSA) The Alexander City, AL MISA is added to the Birmingham-Hoover-Talladega, AL CSA (142). The Bonham, TX MISA is added to the Dallas-Fort Worth, TX-OK Combined Statistical Area (206). The Fort Payne, AL MISA is added to the Huntsville-Decatur-Albertville, AL CSA (290). New New England City and Town Area (NECTA) with Principal City and Components Claremont, NH Micropolitan New England City and Town Area (72500) Principal City: Claremont Sullivan County, NH (part) Claremont city, Unity town New Combined New England City and Town Area and Components Claremont-Lebanon, NH-VT Combined New England City and Town Area (725) Claremont, NH Micropolitan New England City and Town Area Lebanon, NH-VT Micropolitan New England City and Town Area Other Changes • Bedford city, a component of the Lynchburg, VA MSA, changed to town status and was added to Bedford County. • The name of Macon, GA, the principal city of the Macon, GA MSA, as well as a principal city of the Macon-Warner Robins, GA CSA is now Macon-Bibb County. .. The new title of the MSA is Macon-Bibb County, GA MSA. .. The new title of the CSA is Macon-Bibb County--Warner Robins, GA CSA. • Sanford town, ME, a component of Sanford, ME Micro New England City and Town Area, is now Sanford city, ME. • The code for Peoria-Canton, IL CSA is now 427. ProximityOne User Group Join the ProximityOne User Group to keep up-to-date with new developments relating to metros and component geography decision-making information resources. Receive updates and access to tools and resources available only to members. Use this form to join the User Group. Support Using these Resources Learn more about accessing and using demographic-economic data and related analytical tools. Join us in a Data Analytics Lab session. There is no fee for these one-hour Web sessions. Each informal session is focused on a specific topic. The open structure also provides for Q&A and discussion of application issues of interest to participants. Additional Information ProximityOne develops geographic-demographic-economic data and analytical tools and helps organizations knit together and use diverse data in a decision-making and analytical framework. We develop custom demographic/economic estimates and projections, develop geographic and geocoded address files, and assist with impact and geospatial analyses. Wide-ranging organizations use our tools (software, data, methodologies) to analyze their own data integrated with other data. Follow ProximityOne on Twitter at www.twitter.com/proximityone. Contact ProximityOne (888-364-7656) with questions about data covered in this section or to discuss custom estimates, projections or analyses for your areas of interest. |
|
|