|
|
|
Metro Demographic Economic Patterns
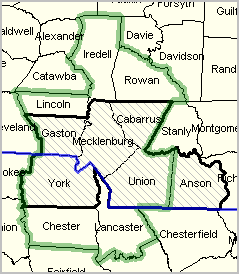
... using ACS 2013 1-year Demographic Economic Data October 2014. The good news is that for the first time, we now have extensive 2013 demographic-economic data for the February 2013 vintage Core-Based Statistical Areas (2013 Metros). These data are from the 2013 American Community Survey (2013 ACS) 1-Year estimates program. Prior to this, data from recent annual ACS program were for earlier vintage CBSAs. See graphic at lower right showing the Charlotte-Concord-Gastonia, NC-SC MSA 2010 boundary compared to 2013 boundary. The bad news, in a sense, is that it is now more difficult to examine demographic-economic change (over time) for the CBSAs experiencing a change in county composition between these vintages. These will be the most current set of detailed demographic-economic data for these metros until the 2014 ACS data are released in September 2015. Selected items are shown for each metro in the interactive table below. The table includes all 539 metros tabulated in ACS 2013 (metros 65,000 population and over). This group includes 381 metropolitan statistical areas, 31 metropolitan divisions and 127 micropolitan statistical areas. Use the table to rank, compare and contrast metros. For example, see that among all MSAs Cumberland, MD has the lowest median gross rent ($486) compared to San Jose, CA with the highest median gross rent ($1,640). See description of items below table. Access the same subject matter for these and other geographies via the ACS 2013 API table Patterns of Economic Prosperity by Metro 2013 median household income patterns by 2013 Vintage CBSA 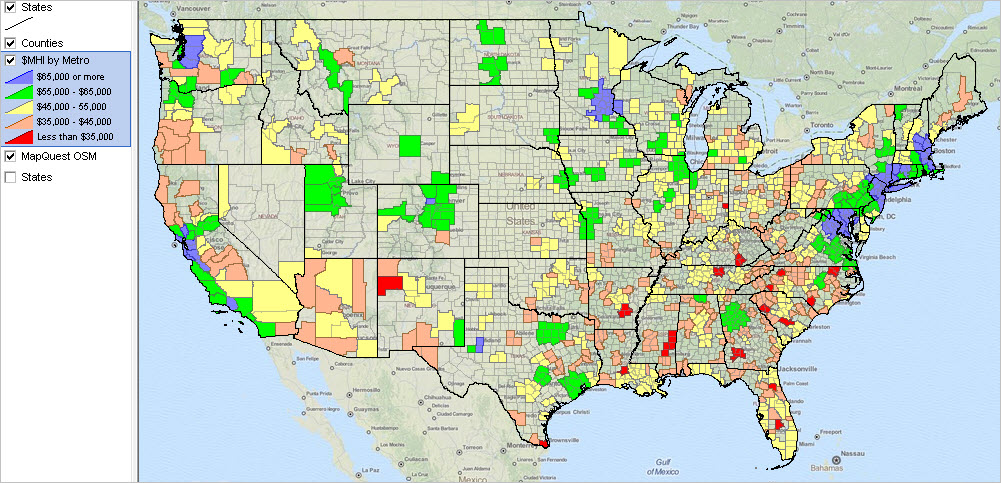 View developed using CV XE GIS and related GIS project. Click graphic for larger view with more details. 2013 Demographic Economic Characteristics by 2013 CBSA Interactive Table Click column header to sort; click again to sort other direction; Click ShowAll button between queries. See related Ranking Tables Main Page Usage Notes • Click on a column header to sort on that column; click column header again to sort in other direction. • Click ShowAll button to show all areas and restore full set of data view. • Click State to view a selected state (click ShowAll between selections). • Find in Name: key in partial CBSA name in text box to right of Find in Name button then click button to locate all matches (case sensitive) based on CBSA name column. Using Miami illustrates how the MSA and Metropolitan Divisions can be viewed together. (metropolitan divisions exist only for a few MSAs that meet certain conditions) • Adjust column width by dragging column divider bar in top row. Columns and Example of Data Area name: San Diego-Carlsbad, CA Metro Area State: CA Type: Metro CBSA Code: 41740 MD Code: NA Total population: 3,211,252 One race alone: White: 2,293,611 One race alone: Black: 162,450 One race alone: AI/AN: 20,836 One race alone: Asian: 360,899 One race alone: NHOPI: 15,267 Other race alone: 207,408 Multiple races: 150,781 Hispanic population: 1,057,428 Median age (total population): 35.1 Total housing units: 1,176,799 Occupied housing units/households: 1,093,386 Median household income: $61,426 Percent high school graduate: 85.5 Percent college graduate: 34.6 Median housing value: $411,000 Median gross rent: $1,289 ProximityOne User Group Join the ProximityOne User Group to keep up-to-date with new developments relating to children's demographics and school district decision-making information resources. Receive updates and access to tools and resources available only to members. Use this form to join the User Group. There is no fee. Support Using these Resources Learn more about demographic economic data and related analytical tools. Join us in a Decision-Making Information Web session. There is no fee for these one-hour Web sessions. Each informal session is focused on a specific topic. The open structure also provides for Q&A and discussion of application issues of interest to participants. Additional Information ProximityOne develops geographic-demographic-economic data and analytical tools and helps organizations knit together and use diverse data in a decision-making and analytical framework. We develop custom demographic/economic estimates and projections, develop geographic and geocoded address files, and assist with impact and geospatial analyses. Wide-ranging organizations use our tools (software, data, methodologies) to analyze their own data integrated with other data. Follow ProximityOne on Twitter at www.twitter.com/proximityone. Contact ProximityOne (888-364-7656) with questions about data covered in this section or to discuss custom estimates, projections or analyses for your areas of interest. |
|
|