
|
|
|
Households by Computer Use & Internet Access 2013 data for U.S., states, metros, congressional districts, counties, cities, school districts
September 2014. As of 2013, there were 998 school districts having population 65,000 or more. Households in these school districts having broadband Internet access ranged from 33.2% to 95.1%. There were 508 metros having population 65,000 or more. Households in these metros having broadband Internet access ranged from 29.5% to 86.1%. Use the interactive table in this section to determine how school districts and metros rank. See related section on computer and Internet access. Mandated by the 2008 Broadband Data Improvement Act, questions on computer and Internet usage are included in the American Community Survey 2013 (ACS 2013) for the first time. This section provides access to these data using an interactive table and illustrates use of the data using GIS resources. These data are available for areas 65,000 population and over including the U.S. and all states, metropolitan statistical areas (MSAs), Public Use Microdata Areas (PUMAs), and 113th Congressional Districts as well as large cities, counties and school districts. Percent Households with Broadband Internet Access by Metro The following view shows percent households with broadband Internet access by metro (blue 80% or more; red 50%or less). Click graphic for larger view showing color/pattern legend and mini-profile for a selected metro illustrating data values and subject matter available. Use GIS tools to examine other attributes of computer and Internet access by household for different types of geography. 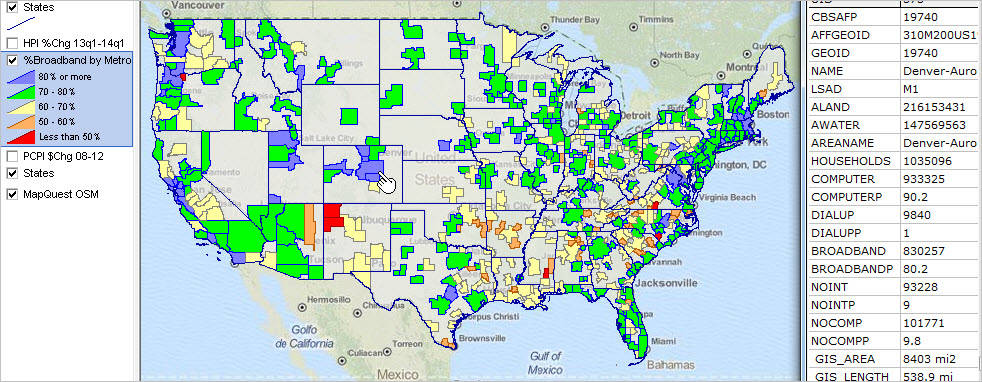 View developed using CV XE GIS software and related GIS project. Click graphic for larger view with more detail. 2013 Households by Computer & Internet Access Interactive Table ... rank by column Selected type of geographies; click GeoLev button below table to view by type Click column header to sort; click again to sort other direction. See related Ranking Tables Main Page Usage Notes • Click on a column header to sort on that column; click column header again to sort in other direction. • Click ShowAll button to show all areas and restore full set of data view. • Click State to view a selected state (click ShowAll between selections). • Find by Name: key in partial area name in text box to right of Find-in-Name button then click button to locate all matches (case sensitive). • See related ranking tables. Column Headers • AreaName • St • GeoLev • GeoLev1 • Code • Stfips • Total Households • Households With Computer • Percent Households with Computer • Households with Internet Access - Dial-up • % Households with Internet Access - Dial-up • Households with Internet Access - Broadband • % Households with Internet Access - Broadband • Households with No Internet Access • % Households with No Internet Access • Households with No Computer • %Households with No Computer ProximityOne User Group Join the ProximityOne User Group to keep up-to-date with new developments relating to district decision-making information resources. Receive updates and access to tools and resources available only to members. Use this form to join the User Group. There is no fee. Support Using these Resources Learn more about demographic economic data and related analytical tools. Join us in a Decision-Making Information Web session. There is no fee for these one-hour Web sessions. Each informal session is focused on a specific topic. The open structure also provides for Q&A and discussion of application issues of interest to participants. Additional Information ProximityOne develops geographic-demographic-economic data and analytical tools and helps organizations knit together and use diverse data in a decision-making and analytical framework. We develop custom demographic/economic estimates and projections, develop geographic and geocoded address files, and assist with impact and geospatial analyses. Wide-ranging organizations use our tools (software, data, methodologies) to analyze their own data integrated with other data. Follow ProximityOne on Twitter at www.twitter.com/proximityone. Contact ProximityOne (888-364-7656) with questions about data covered in this section or to discuss custom estimates, projections or analyses for your areas of interest. |
|
|