
|
|
|
Essential to business data analytics, the American Community Survey (ACS) is a nationwide survey designed to provide annually updated demographic-economic data for national and sub-national geography. This section is focused on ACS 2014 data access, integration and use and is progressively updated. Keep informed about ACS developments and related tools and applications: • Updates are sent to ProximityOne User Group members (join here). ... access special extract files and GIS projects available to members. • ACS updates and applications are covered in the Data Analytics Blog. • ACS data access, integration & use ... join us in a Data Analytics Lab session. ACS 2014 Data Release Dates - scroll section
07.24.16 -- ACS 2014 1-year "Supplemental" Estimates
.. 1-year estimates for areas 20,000 population or more .. http://proximityone.com/acs2014s.htm 09.17.15 -- ACS 2014 1-year Estimates - 2014 demographic-economic estimates for areas of 65,000 population or more. 10.27.15 -- ACS 2014 1-Year Public Use Microdata Sample (PUMS) File - create custom estimates. - use person/household-oriented models for behavioral analysis. 12.3.15 -- ACS 2014 5-year Estimates - 2010-14 demographic-economic estimates for all areas. - more about: http://proximityone.com/acs1014.htm - access via http://proximityone.com/dede.htm 01.21.16 -- ACS 2014 5-Year Public Use Microdata Sample (PUMS) File 05.15.16 -- ACS 2014 SDST - 5-year estimates, School District Special Tabulation Applications -- Interactive Tables; GIS Resources; Studies/Briefs Summary: • Rental Market Conditions by State & Metro • State Median & Mean Household & Family Income 2012-2014 • Metropolitan Area Housing Value & Household Income: 2013-2014 • U.S., State Metropolitan Area extended datasets: interactive tables and GIS/Shapefiles: .. General Demographics | Social Characteristics | Economic Characteristics | Housing Characteristics • 114th Congressional Districts: Median Income and Housing Value • 114th Congressional Districts extended datasets: interactive tables and GIS/Shapefiles: .. General Demographics | Social Characteristics | Economic Characteristics | Housing Characteristics Rental Market Conditions by State & Metro - interactive table & GIS tools/applications - See http://proximityone.com/metro_rentalmarket.htm Atlanta/Southeastern U.S. rental vacancy rate by metro  State Median & Mean Household & Family Income 2012-2014 - examining patterns of well-being - interactive table and data profiles - http://proximityone.com/state_income.htm Metropolitan Area Housing Value & Household Income: 2013-2014 The following graphic illustrates use of the ACS 2014 data to develop a thematic pattern map of median household income by metro (515 metros that have 65,000 or more population). This graphic makes use of one subject matter item among hundreds of ACS subject matter items tabulated. Click graphic for larger view showing legend and mini profile example. 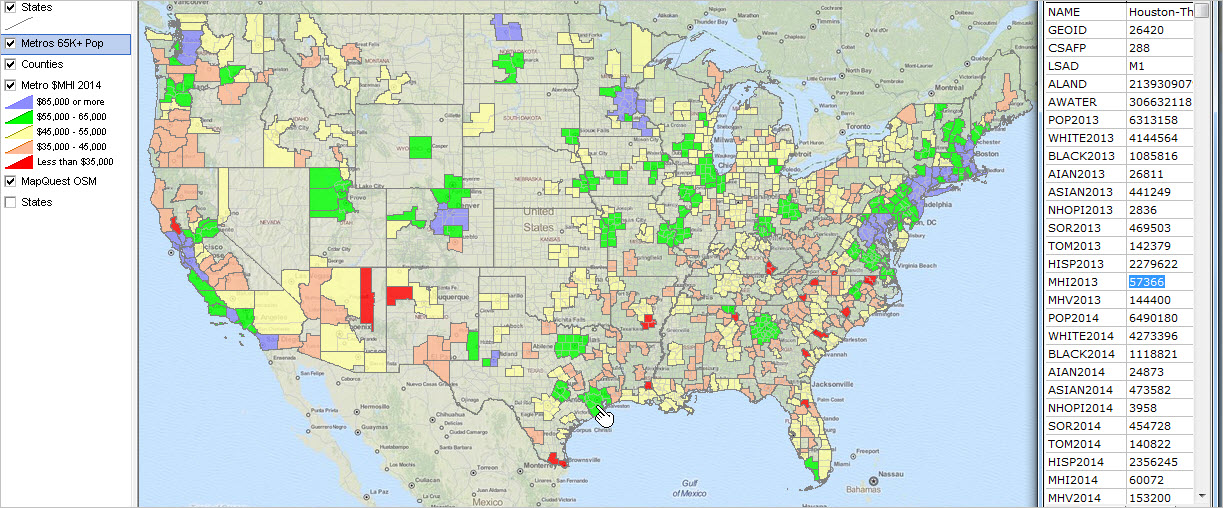 -- view developed using CV XE GIS software and related GIS project. See more about Metropolitan Area Housing Value & Household Income: 2013-2014 -- interactive ranking table & GIS projects/datasets 114th Congressional Districts: Median Income and Housing Value The following graphic illustrates use of the ACS 2014 data to develop a thematic pattern map of median household income by 114th Congressional District. This graphic makes use of one subject matter item among hundreds of ACS subject matter items tabulated. Click graphic for larger view showing county overlay and CD mini profile example. 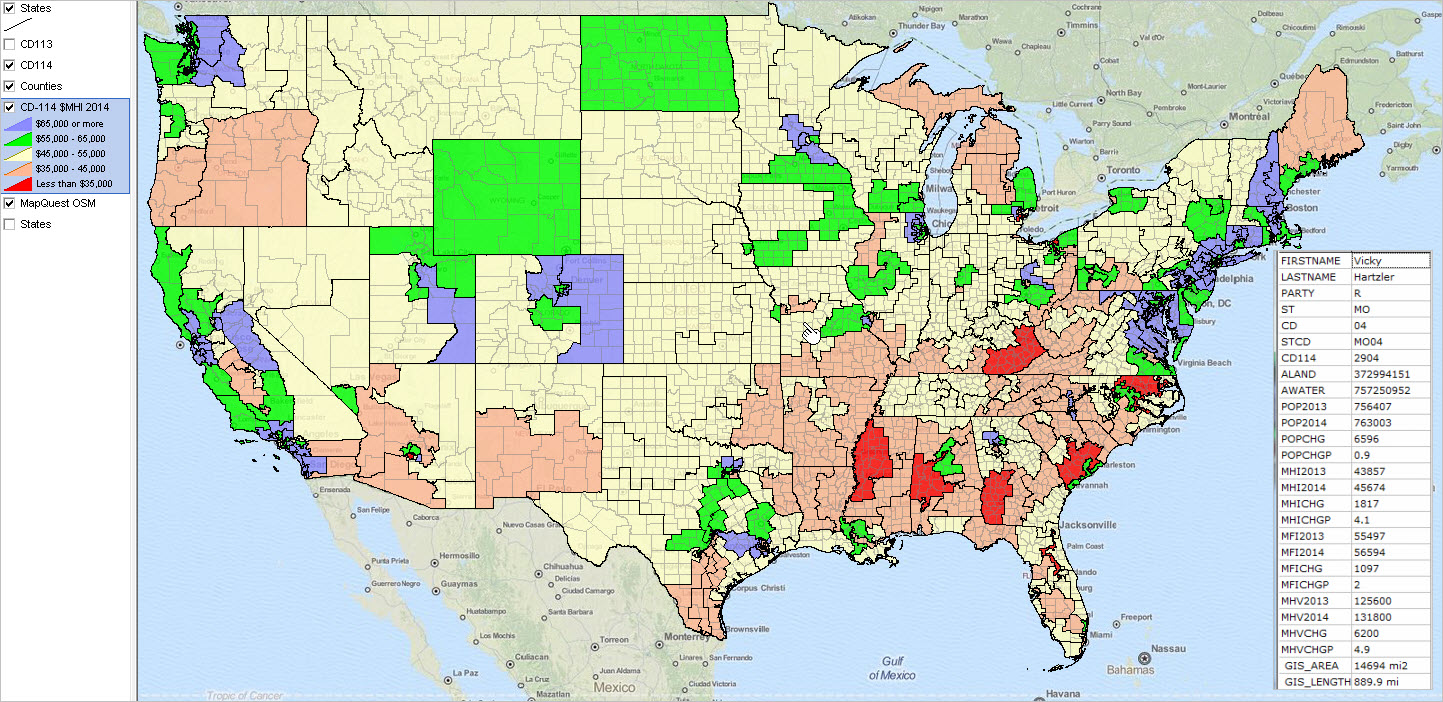 -- view developed using CV XE GIS software and related GIS project. See more about Congressional District Median Income & Housing Value: 2013-2014 -- interactive ranking table & GIS projects/datasets Reference • Tabulation Area Names & Geocodes (xls) • Questionnaire (pdf) • Group Quarters Questionnaire (pdf) • 2014 U.S. Gazetteer Files ... geography in these files matches the 2014 American Community Survey data Subject Matter Topics & Coverage ... scroll section Click link to access data & view more detail; opens new window.
Demographic
Age and Sex Group Quarters Population Hispanic or Latino Origin Race Relationship Total Population Housing Computer Ownership & Internet Access House Heating Fuel Kitchen Facilities Occupancy/Vacancy Status Occupants per Room Owner Monthly Costs Plumbing Facilities Rent Statistics Rooms Bedrooms Telephone Service Available Tenure Units in Structure Value of Home Vehicles Available Year Householder Moved Into Unit Year Structure Built Economic Class of Worker Commuting to Work/Journey to Work Employment Status Food Stamps/Supplemental Nutrition Assistance Program (SNAP) Health Insurance Coverage Income and Earnings Industry and Occupation Poverty Work Status Social Ancestry Citizenship Status Disability Status Educational Attainment Fertility Field of Degree Grandparents as Caregivers Language Marital History Marital Status Place of Birth School Enrollment Residence 1 Year Ago/Migration Veterans Year of Entry Scope of Geographic Areas Tabulated ... scroll section
Using ACS Data; ACS 1-Year versus ACS 5-Year Data [top] While ACS 1-year estimates are suitable for time-series analyses, the ACS 5-year estimates are not the same as annual demographic-economic estimates and may not be suitable for annual time series analyses. Advantages of using the 5-year estimates • the data are available for all census tracts and ZIP code areas. • the data are available for all cities/places, counties and school districts irrespective of size. Disadvantages of using the 5-year estimates • the data are older than the 1-year estimates. • the data are for a 5-year period rather than one year. • additional cautions in comparing estimates over time (see below). Advantages of using the 1-year estimates • the data are more recent than the 5-year estimates. • the data are generally more accurate than the 5-year estimates. Disadvantages of using the 5-year estimates • the data are not available for census tracts and ZIP code areas. • the data are available for only areas of 65,000 population and over. • the margin of error (MOE) of the estimate is normally larger that for the 5-year estimates. Additional cautions in comparing estimates over time • ACS 2012 5 year estimates are based on survey respondent data for the years 2008 through 2012. • ACS 2013 5 year estimates are based on survey respondent data for the years 2009 through 2013. • ACS 2014 5 year estimates are based on survey respondent data for the years 2010 through 2014. • The ACS 2012 5 year data & ACS 2013 5 year data are based on the same respondent data for the four years 2009 through 2012. • The ACS 2013 5 year estimates drop 2008 respondents and add 2013 respondents. • The ACS 2014 5 year estimates drop 2009 respondents and add 2014 respondents. • While 5-year estimates are independently developed annually, they include demographic-economic characteristics for some of the same respondents. • Geographic boundaries and/or geographic codes are often different for different ACS years/vintages. Examples: - February 2013 metros definitions are used for ACS 2013 & 2014; previous metro vintages are used for earlier ACS years - Current OMB definition metros will be used in ACS 2015 forward (until they change again) Other considerations • Are the needed subject matter available from Census 2010? - ACS more detailed demographic-economic data (like income) may not be a plus. • Census 2010 provides more accurate data than ACS estimates. • Often there are more detailed age (and other) breakouts for subject matter in Census 2010 compared to ACS. • The most recent ACS-sourced small area data are from ACS 2013 (2014 as of December 2015) 5-year estimates; - ACS 2013 (ACS 2014) estimates are centric to 2011 (2012) ProximityOne User Group Join the ProximityOne User Group to keep up-to-date with new developments relating to metros and component geography decision-making information resources. Receive updates and access to tools and resources available only to members. Use this form to join the User Group. Support Using these Resources Learn more about accessing and using demographic-economic data and related analytical tools. Join us in a Data Analytics Lab session. There is no fee for these one-hour Web sessions. Each informal session is focused on a specific topic. The open structure also provides for Q&A and discussion of application issues of interest to participants. Additional Information ProximityOne develops geodemographic-economic data and analytical tools and helps organizations knit together and use diverse data in a decision-making and analytical framework. We develop custom demographic/economic estimates and projections, develop geographic and geocoded address files, and assist with impact and geospatial analyses. Wide-ranging organizations use our tools (software, data, methodologies) to analyze their own data integrated with other data. Follow ProximityOne on Twitter at www.twitter.com/proximityone. Contact us (888-364-7656) with questions about data covered in this section or to discuss custom estimates, projections or analyses for your areas of interest. | |||||||||||||||||||||||||||||||||||||||||||||||||||||||||||||||||||||||||||||||||||||||||||||||||||||||||||||||||||||||||||||||||||||||||||||||||||||||||||||
|
|