
|
|
|
State Median & Mean Household & Family Income 2012-2014 -- examining patterns of well-being
This section is focused on recent patterns of median and mean household and family income between 2012 and 2014 (most recent estimate as of November 2015), based on American Community Survey 1-year estimates (ACS 2014) for the U.S. overall and by state. The interactive table below provides tools enabling you to compare/analyze geography, income measures and change for areas of interest. There are many sources of national scope income measures. The ACS median and mean household income measures are used in part because these data are also available with geographic drill-down to the block group level of geography. We are able to assess some aspect of well-being for small area geographies. The ACS also enables analysis of similar income measures for other population groups, such as by race/ethnicity, and for nonfamily households, and others. For areas of 65,000 population and over, the ACS also provides the most recent measures. Data examined here include: • median and mean household income between 2012 and 2014 by state & U.S. • median and mean family income between 2012 and 2014 by state & U.S. See more about subject matter topics below. Also see more about what is included in how income data and how it is collected below. Patterns of 2014 Median Household Income by State The following graphic shows patterns of 2014 median household income (MHI) by state. Blue and green color states are above the U.S. 2014 MHI. Color fill patterns and intervals shown in larger view (click graphic). Bar charts show 2012-2014 change in median family income (green) and median household income (blue).  View developed with CV XE GIS software. Click graphic for larger view. U.S. by State, larger view, 2014 Median Household Income (MHI) with MHI as labels Median Compared to Mean The median and mean both provide measures centrality of the distribution of households (families). The median is that point where half of the households (families) have an income above that point and half of the households (families) have an income below that point. The mean/average is the sum of all household (family) income divided by the number of households (families). Of the four measures included here ($MHI, $AHI, $MFI, $AFI), median household income is the most widely used. This might be due to custom, the desire to simplify analyses, or because users believe that households are the primary buying unit rather than families. That does not make use of $MHI always preferred and the best approach is to examine patterns among each measure and what they "say" together. For a given geographic area, the mean income measure is almost always higher than median income. The mean/median family income is almost always higher than the mean/median household income. A family is two or more persons, and often includes more than one wage earner. A household might be one person, or include older population, perhaps on a fixed income. Extending the Geographic Scope of Analysis The concepts, methods, data and tools used here could be equally applied to metros, congressional districts, public use microdata areas, and for other areas 65,000 population or more (counties, cities, school districts, among others). The 2014 $AHI for New York County, NY/Manhattan is $134,776 compared to $101,025 for the State of New York. Are Californians better off than New Yorkers? ... using the interactive table .. an example ... pick your state. In making comparisons, note that these measures only tell us only about two recent points in time. The data only tell us about income and two types of income measures. The data are estimates, subject to errors of estimation. The two measures do not provide insights into why the differences exist. Some insights into the structure of the underlying distributions can be determined by clicking the AreaName link. The link opens a new page showing an economic profile for the state/U.S. Within the economic profile are the number of households (families) by income range -- you can see the skewing, or not, within the distribution which may help explain why/how the mean and median are different. Note that the economic profile opens with the 2014 data. There is a link at the left in the profile to open the same profile for a different year. • California 2014 $MHI $61,933 compared to U.S.$53,657 -- CA to US index: 115.42 • California 2014 $AHI $88,595 compared to U.S.$75,591 -- CA to US index: 117.20 • California 2014 $MFI $71,015 compared to U.S.$65,910 -- CA to US index: 107.74 • California 2014 $AFI $98,670 compared to U.S.$88,394 -- CA to US index: 111.62 Examine the change and rates using the table. Click on header column cell to rank on any column/measure. To compute index values, click on a row and copy to clipboard. Paste in Excel/spreadsheet as row1. Click comparison area row and copy to clipboard. Paste in Excel/spreadsheet as row 2. Enter cell computations to compute index values in row 3. 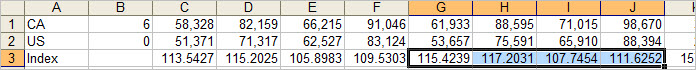
State Median & Mean Household & Family Income: 2012 - 2014 -- Interactive Table Use the interactive table shown below to examine attributes of ZIP Code areas. Click column header to sort; again to sort other direction. Usage notes below table. See related Ranking Tables Main Page Usage Notes • Click ShowAll between queries/filters. Columns & Subject Matter Items • AreaName • Code -- FIPS State code • $MHI 2012 -- Median household income, ACS 2012 1-year estimate • $AFI 2012 -- Mean household income, ACS 2012 1-year estimate • $MFI 2012 -- Median family income, ACS 2012 1-year estimate • $AFI 2012 -- Mean family income, ACS 2012 1-year estimate • $MHI 2014-- Median household income, ACS 2014 1-year estimate • $AHI 2014 -- Mean household income, ACS 2014 1-year estimate • $MFI 2014 -- Median family income, ACS 2014 1-year estimate • $AFI 2014 -- Mean family income, ACS 2014 1-year estimate • $MHI Change 2012-2014 -- Median household income, ACS 2012 to 2014 change • $AHI Change 2012-2014 -- Mean household income, ACS 2012 to 2014 change • $MFI Change 2012-2014 -- Median family income, ACS 2012 to 2014 change • $AFI Change 2012-2014 -- Mean family income, ACS 2012 to 2014 change • $MHI %Chg 2012-2014 -- Median household income, ACS 2012 to 2014 percent change • $AHI %Chg 2012-2014 -- Mean household income, ACS 2012 to 2014 percent change • $MFI %Chg 2012-2014 -- Median family income, ACS 2012 to 2014 percent change • $AFI %Chg 2012-2014 -- Mean family income, ACS 2012 to 2014 percent change Subject Matter Topics Family. A family consists of two or more people (one of whom is the householder) related by birth, marriage, or adoption residing in the same housing unit. A householder with one or more other persons living in the same household who are related to the householder by birth, marriage, or adoption. The definition of family excludes one-person households and multi-person households of unrelated individuals. Household. A household consists of all people who occupy a housing unit regardless of relationship. A household may consist of a person living alone or multiple unrelated individuals or families living together. Family income. Family income includes income of the householder and all other people 15 years and older in the family. Household income. Household income includes income of the householder and all other people 15 years and older in the household, whether or not they are related to the householder. Median. The median is that point that divides the household (family) income distribution into halves, one-half with income above the median and the other with income below the median. The median is based on the income distribution of all households (families), including those with no income. Income Questions -- ACS 2015 Questionnaire
This section summarizes the scope of questions (47 and 48) used on the
ACS 2015 questionnaire
pertaining to measuring "INCOME IN THE PAST 12 MONTHS". Respondents enter whole dollar amounts as response to each
question. In the text below, the question is stated verbatim; related instructions are also provided.
Questionnaire lead instructions: DO NOT include the following as income in any item: • Refunds or rebates of any kind • Withdrawals from savings of any kind • Capital gains or losses from the sale of homes, shares of stock, etc. • Inheritances or insurance settlements • Any type of loan • Pay in-kind such as food, free rent 47a. Wages, salary, commissions, bonuses, or tips from all jobs. Report amount before deductions for taxes, bonds, dues, or other items. Instructions: Include wages and salaries before deductions from all jobs. Be sure to include any tips, commissions, or bonuses. Owners of incorporated businesses should enter their salary here. Military personnel should include base pay plus cash housing and/or subsistence allowance, flight pay, uniform allotments, reenlistment bonuses. 47b. Self-employment income from own nonfarm businesses or farm businesses, including proprietorships and partnerships. Report NET income after business expenses. Instructions: Include nonfarm profit (or loss) from self-employment in sole proprietorships and partnerships. Mark the "Loss" box if there is a loss. Exclude profit (or loss) of incorporated businesses the person owns. Instructions: Include farm profit (or loss) from self-employment in sole proprietorships and partnerships. Mark the "Loss" box if there is a loss. Exclude profit (or loss) of incorporated farm businesses the person owns. Also exclude amounts from land rented for cash but include amounts from land rented for shares. 47c. Interest, dividends, net rental income, royalty income, or income from estates and trusts. Report even small amounts credited to an account. Instructions: Include interest received or credited to checking and saving accounts, money market funds, certificates of deposit (CDs), IRAs, KEOGHs, and government bonds. Include dividends received, credited, or reinvested from ownership of stocks or mutual funds. Include profit (or loss) from royalties and the rental of land, buildings or real estate, or from roomers or boarders. Mark the "Loss" box if there is a loss. Income received by self-employed persons whose primary source of income is from renting property or from royalties should be included in 47b. Include regular payments from an estate or trust fund. 47d. Social Security or Railroad Retirement. Instructions: Include amounts, before Medicare deductions, of Social Security and/or Railroad Retirement payments to retired persons, to dependents of deceased insured workers, and to disabled workers. 47e. Supplemental Security Income (SSI). Instructions: Include Supplemental Security Income (SSI) received by elderly, blind, or disabled persons. 47f. Any public assistance or welfare payments from the state or local welfare office. Instructions: Include any public assistance or welfare payments received by check or electronic transfer from the state or local welfare office, even if received for only one month or less than a year. Include benefits received on behalf of children. These payments are sometimes referred to as Temporary Assistance for Needy Families (TANF), Aid to Families with Dependent Children (AFDC), Aid to Dependent Children (ADC), Welfare or welfare to work, General Assistance, General Relief, Emergency Assistance, and Diversion Payments. Do not include assistance received from private charities. Do not include Supplemental Security Income (SSI), food assistance (such as food stamps and benefits from the Supplemental Nutrition Assistance Program, or SNAP), rental assistance, education assistance, child care assistance, transportation assistance, or assistance with heating or cooling costs or any other energy assistance (such as Low Income Home Energy Assistance Program, or LIHEAP). 47g. Retirement, survivor, or disability pensions. Do NOT include Social Security Instructions: Include retirement, survivor or disability benefits received from companies and unions, federal, state, and local governments, and the U.S. military. Include regular income from annuities and IRA or KEOGH retirement plans. 47h. Any other sources of income received regularly such as Veterans' (VA) payments, unemployment compensation, child support or alimony. Do NOT include lump sum payments such as money from an inheritance or the sale of a home. Instructions: Include Veterans' (VA) disability compensation and educational assistance payments (VEAP); unemployment compensation, worker's compensation, child support or alimony; and all other regular payments such as Armed Forces transfer payments, assistance from private charities, regular contributions from persons not living in the household. 48. What was this person's total income during the PAST 12 MONTHS? Add entries in questions 47a to 47h; subtract any losses. If net income was a loss, enter the amount and and mark (X) the "Loss" box next to the dollar amount. Instructions: Add the total entries (subtracting losses) for 47a through 47h for the PAST 12 MONTHS and enter that number in the space provided. Mark the "Loss" box if there is a loss. Print the total amount in dollars. Support Using these Resources Join us in a Data Analytics Lab session. There is no fee for these one-hour Web sessions. Each informal session is focused on a specific topic. The open structure also provides for Q&A and discussion of application issues of interest to participants. ProximityOne User Group Join the ProximityOne User Group to keep up-to-date with new developments relating to geographic-demographic-economic decision-making information resources. Receive updates and access to tools and resources available only to members. Use this form to join the User Group. Additional Information ProximityOne develops geographic-demographic-economic data and analytical tools and helps organizations knit together and use diverse data in a decision-making and analytical framework. We develop custom demographic/economic estimates and projections, develop geographic and geocoded address files, and assist with impact and geospatial analyses. Wide-ranging organizations use our tools (software, data, methodologies) to analyze their own data integrated with other data. Follow ProximityOne on Twitter at www.twitter.com/proximityone. Contact ProximityOne (888-364-7656) with questions about data covered in this section or to discuss custom estimates, projections or analyses for your areas of interest. |
|
|