
|
|
|
-- 2009-13 5-Year Estimates There are several things to like about the new American Community Survey 2013 (ACS 2013) 5-year demographic-economic data. These data are one year more recent data than released in December 2013 (the ACS 2012 5-year data). As a result, they provide an updated and more current picture. Two, this is a fourth year sequel to having Census 2010 vintage census tract and block group data available. This de facto four year mini-time series enables a start to examine trends. Three, these estimates are centric to mid-2011 and thus roughly update what would have been "richer demographics" from Census 2010 (had the long-form not been eliminated). These data provide unique and powerful measures that facilitate development of decision-making information. See related: • ACS 2010-14 5-year estimates; corresponding next/more recent year. • Comparing ACS 2005-09 & ACS 2010-14 5-year estimates. • This section updates with ACS 2018 estimates in late December 2019. .. release date 12/19/19. This section is focused on ACS 2013 5-year estimates data access and use, applications using these data and the integration and analysis of these data with other data. Census 2010 and ACS 2013 provide the most current Census-sourced demographics for wide-ranging geography. • Reference & Documentation • Updates & Applications • Data Resources • Data Access/Integration Tools Reference & Documentation • Table Shells (xls) • Summary File 5-year Appendices (block group availability by table -- xls) • Technical Documentation (pdf) Applications & Updates -- scroll section
10.20.15. Mapping ZIP Code Demographics
... tools and data resources for analyzing ZIP Code area patterns ... interactive table & GIS applications ... http://proximityone.com/mapping_zipcode_demographics.htm 08.13.15. Location-Based Demographic-Economic Characteristics ... interactive API-based data access & display tool ... http://proximityone.com/location_based_demographics.htm 02.17.15. Financial Institutions & Neighborhood Characteristics ... examining relationships: FDIC-insured banks and savings institution locations and ACS 2013 census tract demographic-economic characteristics ... http://proximityone.com/fim1.htm ... visualizing patterns ... Houston area ... ... 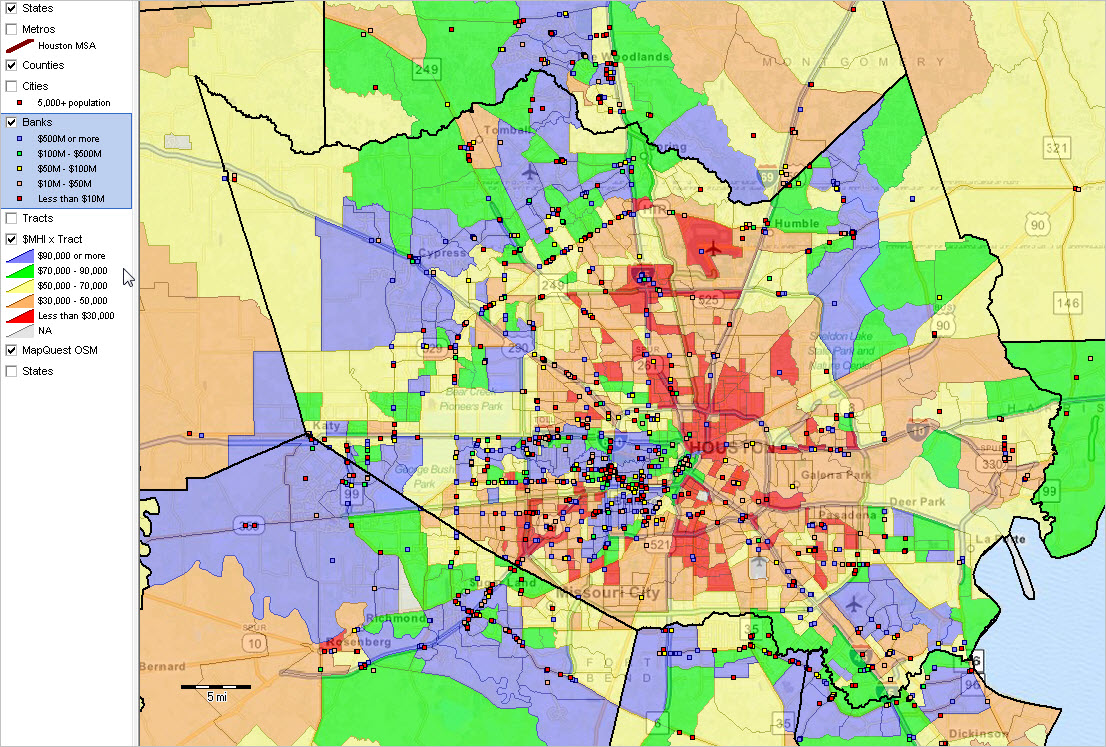 02.14.15. New ACS-Based Voting Rights Act Demographics ... ACS 2009-13 Special Tabulation Citizen Voting Age Population (CVAP) estimates by race/origin ... examining relationships between legislative districts, census tracts, voting districts & census blocks ... interactive table -- http://proximityone.com/cvap_tracts_2013.htm ... visualizing patterns ... Los Angeles area ... ... 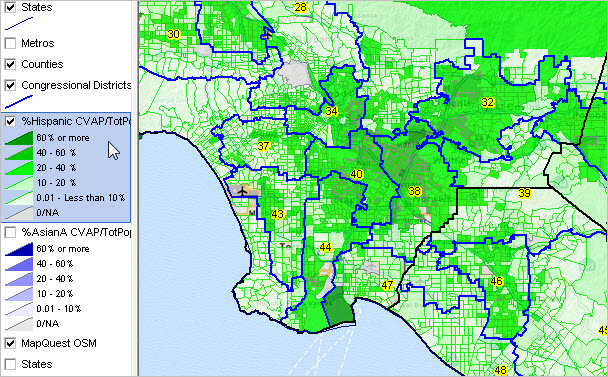 01.29.15. Patterns of Block Group Income Inequality ... data and tools to examine patterns of income equality by block group ... http://proximityone.com/blockgroup_income_inequality.htm ... patterns of income inequality by block group; New York city; click for larger view  01.26.15. Daytime Population: U.S. by State & County ... annual update based on ACS 2013 ... interactive table; GIS project: http://proximityone.com/daytime_population2013.htm ... Atlanta metro area by county: patterns of employment-residence ratio:  01.12.15. Arizona K-12 Schools & School Districts GIS Project ... examining schools/school districts and neighborhood characteristics using ACS 2013 data ... downloadable GIS project & related datasets; 2012-13 school/school districts & attributes ... see http://proximityone.com/k12_az.htm Patterns of economic prosperity by neighborhood; Mesa Unified in context of Mesa city:  12.17.14. New U.S. by ZIP Code Demographic-Economic Profile Datasets ... U.S. by ZIP Code 2013 DEP1-DEP4 (XLS/DBF/shapefiles) datasets (see below) now available. ... these data correspond to 2012 data available in these interactive table. ... contact us for details 12.16.14. ACS 2013 Data Access, Integration & Analysis ... one hour no fee Web sessions. ... more information: http://proximityone.com/acs_sessions.htm ... register 12.15.14. Economic Prosperity of ZIP Code Areas ... all ZIP code area interactive table & GIS applications. ... http://proximityone.com/acs0913_zips.htm 12.08.14. America's Communities Profiles Update ... selected ACS 2013 5-year estimates data integrated into city/place profiles. ... more information: http://proximityone.com/acp.htm 12.04.14. December 4 Data Release ... http://proximityone.com/finding_your_data.htm ... The ACS 2013 5-year estimates were released 12/4/14. Data Resources 1. Demographic-Economic Profile Datasets - ready to use ProximityOne has developed annual Demographic-Economic Profile (DEP) datasets for ACS 2010 through ACS 2013. ProximityOne uses these data to develop current (2014) estimates and 5-year projections (to 2018). These datasets are available for the U.S. by state, county, congressional district, metropolitan area, city, school district, ZIP Code area and census tract.
AGE AND GENDER
D001 Total population D002 Male D003 Female D004 Under 5 years D005 5 to 9 years D006 10 to 14 years D007 15 to 19 years D008 20 to 24 years D009 25 to 34 years D010 35 to 44 years D011 45 to 54 years D012 55 to 59 years D013 60 to 64 years D014 65 to 74 years D015 75 to 84 years D016 85 years and over D017 Median age (years) D018 18 years and over D019 21 years and over D020 62 years and over D021 65 years and over D022 18 years and over D023 Male D024 Female D025 65 years and over D026 Male D027 Female RACE D028 Total population D029 One race D030 Two or more races D031 One race D032 White D033 Black or African American D034 American Indian and Alaska Native D035 Cherokee tribal grouping D036 Chippewa tribal grouping D037 Navajo tribal grouping D038 Sioux tribal grouping D039 Asian D040 Asian Indian D041 Chinese D042 Filipino D043 Japanese D044 Korean D045 Vietnamese D046 Other Asian D047 Native Hawaiian and Other Pacific Islander D048 Native Hawaiian D049 Guamanian or Chamorro D050 Samoan D051 Other Pacific Islander D052 Some other race D053 Two or more races D054 White and Black or African American D055 White and American Indian and Alaska Native D056 White and Asian D057 Black or African American and American Indian and Alaska Native Race alone or in combination with one or more other races D058 Total population D059 White D060 Black or African American D061 American Indian and Alaska Native D062 Asian D063 Native Hawaiian and Other Pacific Islander D064 Some other race HISPANIC OR LATINO AND RACE D065 Total population D066 Hispanic or Latino (of any race) D067 Mexican D068 Puerto Rican D069 Cuban D070 Other Hispanic or Latino D071 Not Hispanic or Latino D072 White alone D073 Black or African American alone D074 American Indian and Alaska Native alone D075 Asian alone D076 Native Hawaiian and Other Pacific Islander alone D077 Some other race alone D078 Two or more races D079 Two races including Some other race D080 Two races excluding Some other race, and Three or more races D081 Total housing units
EMPLOYMENT STATUS
E001 Population 16 years and over E002 In labor force E003 Civilian labor force E004 Employed E005 Unemployed E006 Armed Forces E007 Not in labor force E008 Civilian labor force E009 Percent Unemployed E010 Females 16 years and over E011 In labor force E012 Civilian labor force E013 Employed E014 Own children under 6 years E015 All parents in family in labor force E016 Own children 6 to 17 years E017 All parents in family in labor force COMMUTING TO WORK E018 Workers 16 years and over E019 Car, truck, or van -- drove alone E020 Car, truck, or van -- carpooled E021 Public transportation (excluding taxicab) E022 Walked E023 Other means E024 Worked at home E025 Mean travel time to work (minutes) OCCUPATION E026 Civilian employed population 16 years and over E027 Management, business, science, and arts occupations E028 Service occupations E029 Sales and office occupations E030 Natural resources, construction, and maintenance occupations E031 Production, transportation, and material moving occupations INDUSTRY E032 Civilian employed population 16 years and over E033 Agriculture, forestry, fishing and hunting, and mining E034 Construction E035 Manufacturing E036 Wholesale trade E037 Retail trade E038 Transportation and warehousing, and utilities E039 Information E040 Finance and insurance, and real estate and rental and leasing E041 Professional, scientific, and management, and administrative and waste management services E042 Educational services, and health care and social assistance E043 Arts, entertainment, and recreation, and accommodation and food services E044 Other services, except public administration E045 Public administration CLASS OF WORKER E046 Civilian employed population 16 years and over E047 Private wage and salary workers E048 Government workers E049 Self-employed in own not incorporated business workers E050 Unpaid family workers INCOME AND BENEFITS (IN 2010 INFLATION-ADJUSTED DOLLARS) E051 Total households E052 Less than $10,000 E053 $10,000 to $14,999 E054 $15,000 to $24,999 E055 $25,000 to $34,999 E056 $35,000 to $49,999 E057 $50,000 to $74,999 E058 $75,000 to $99,999 E059 $100,000 to $149,999 E060 $150,000 to $199,999 E061 $200,000 or more E062 Median household income (dollars) E063 Mean household income (dollars) E064 With earnings E065 Mean earnings (dollars) E066 With Social Security E067 Mean Social Security income (dollars) E068 With retirement income E069 Mean retirement income (dollars) E070 With Supplemental Security Income E071 Mean Supplemental Security Income (dollars) E072 With cash public assistance income E073 Mean cash public assistance income (dollars) E074 With Food Stamp/SNAP benefits in the past 12 months E075 Families E076 Less than $10,000 E077 $10,000 to $14,999 E078 $15,000 to $24,999 E079 $25,000 to $34,999 E080 $35,000 to $49,999 E081 $50,000 to $74,999 E082 $75,000 to $99,999 E083 $100,000 to $149,999 E084 $150,000 to $199,999 E085 $200,000 or more E086 Median family income (dollars) E087 Mean family income (dollars) E088 Per capita income (dollars) E089 Nonfamily households E090 Median nonfamily income (dollars) E091 Mean nonfamily income (dollars) E092 Median earnings for workers (dollars) E093 Median earnings for male full-time, year-round workers (dollars) E094 Median earnings for female full-time, year-round workers (dollars) HEALTH INSURANCE COVERAGE E095 .. Civilian Noninstitutionalized Population E096 .... With health insurance coverage E097 ...... With private health insurance coverage E098 ...... With public health coverage E099 .... No health insurance coverage E100 .... Civilian Noninstitutionalized Population Under 18 years E101 ...... No health insurance coverage E102 .... Civilian noninstitutionalized population 18 to 64 years E103 ...... In labor force: E104 ........ Employed: E105 .......... With health insurance coverage E106 ............ With private health insurance E107 ............ With public coverage E108 .......... No health insurance coverage E109 ........ Unemployed: E110 .......... With health insurance coverage E111 ............ With private health insurance E112 ............ With public coverage E113 .......... No health insurance coverage E114 ...... Not in labor force: E115 ........ With health insurance coverage E116 .......... With private health insurance E117 .......... With public coverage E118 ........ No health insurance coverage PERCENTAGE OF FAMILIES AND PEOPLE WHOSE INCOME IN THE PAST 12 MONTHS IS BELOW THE POVERTY LEVEL E119 All families E120 With related children under 18 years E121 With related children under 5 years only E122 Married couple families E123 With related children under 18 years E124 With related children under 5 years only E125 Families with female householder, no husband present E126 With related children under 18 years E127 With related children under 5 years only E128 All people E129 Under 18 years E130 Related children under 18 years E131 Related children under 5 years E132 Related children 5 to 17 years E133 18 years and over E134 18 to 64 years E135 65 years and over E136 People in families E137 Unrelated individuals 15 years and over Data Access, Integration & Analytical Tools 1. Demographic Economic Data Extraction (DEDE) software ... updated to support ACS 2013; DEDE Level 1 available to ProximityOne User Group members 2. CV XE GIS software ... create thematic pattern maps using ACS 2013 data ... CV XE Level 1 available to ProximityOne User Group members 3. Census API -- Accessing ACS 2013 5-year estimates via API ... illustrative API calls ... ACS 2013 5-year estimates; demographic profile items • Clicking the link below returns selected ACS 2013 5-year estimates in JSON structure: ACS 0913 Demographic Profile Items; Santa Clara County (085) CA (06) tract 507001 • Clicking the link below returns selected ACS 2012 5-year estimates in JSON structure: ACS 0812 Demographic Profile Items; Santa Clara County (085) CA (06) tract 507001 Data Structure for above 2013 Example DP05_0028E .. Total population: 7051 DP05_0031E .. One race alone:: 6,875 DP05_0032E .. One race alone: White: 6,465 DP05_0033E .. One race alone: Black: 9 DP05_0034E .. One race alone: AI/AN: 0 DP05_0039E .. One race alone: Asian: 379 DP05_0047E .. One race alone: NH/OPI: 0 DP05_0052E .. One race alone: Other: 22 DP05_0053E .. Multirace: 176 DP02_0066PE .. Percent high school graduate: 97.5 DP02_0067PE .. Percent college graduate: 74.0 DP03_0062E .. Median household income: $135,263 DP04_0001E .. Total housing units: 3,381 DP04_0002E .. Occupied housing units/households: 3,162 DP04_0088E .. Median housing value: $1,000,000+ DP04_0132E .. Median gross rent: $1,900 ACS 2013 Questionnaire A review of the ACS 2013 questionnaire provides insights into what data can be tabulated from respondent data. View ACS 2013 questionnaire (PDF) Tabulation Geography for ACS 2013 Tab-delimited files containing codes, names and related attributes for ACS 2013 tabulation areas may be accessed using the links provided below. The exact scope of areas tabulated may vary from year-to-year. • 113th Congressional Districts • American Indian/Alaska Native/Native Hawaiian Areas • American Indian/Alaska Native/Native Hawaiian Areas - Reservations Only • American Indian/Alaska Native/Native Hawaiian Areas - Trust Lands Only • Census Tracts • Counties • County Subdivisions • Places • School Districts - Elementary • School Districts - Secondary • School Districts - Unified • State Legislative Districts - Lower Chamber • State Legislative Districts - Upper Chamber • Urban Areas • ZIP Code Tabulation Areas About ACS The American Community Survey (ACS) is a nationwide survey conducted by the Census Bureau designed to provide more frequently updated demographics for national and sub-national geography than provided by the decennial census program. The ACS collects and produces population and housing information every year instead of every ten years The ACS currently has an annual sample size of about 3.5 million addresses. ACS is integrally connected with Census 2010. ProximityOne User Group Join the ProximityOne User Group to keep up-to-date with new developments relating to metros and component geography decision-making information resources. Receive updates and access to tools and resources available only to members. Use this form to join the User Group. Support Using these Resources Learn more about accessing and using demographic-economic data and related analytical tools. Join us in a Data Analytics Lab session. There is no fee for these one-hour Web sessions. Each informal session is focused on a specific topic. The open structure also provides for Q&A and discussion of application issues of interest to participants. Additional Information ProximityOne develops geodemographic-economic data and analytical tools and helps organizations knit together and use diverse data in a decision-making and analytical framework. We develop custom demographic/economic estimates and projections, develop geographic and geocoded address files, and assist with impact and geospatial analyses. Wide-ranging organizations use our tools (software, data, methodologies) to analyze their own data integrated with other data. Follow ProximityOne on Twitter at www.twitter.com/proximityone. Contact us (888-364-7656) with questions about data covered in this section or to discuss custom estimates, projections or analyses for your areas of interest. |
|
|