
|
|
|
.. examining workers living/working in area .. population change due to commuting & employment/residence ratio The concept of the daytime population refers to the number of people who are present in an area during normal business hours, including workers. This is in contrast to the resident population present during the evening and nighttime hours. Information on the expansion or contraction experienced by different communities/areas between nighttime and daytime populations is important for many planning purposes, including those dealing with market size, trade/service areas, transportation, disaster, and relief operations. See related Daytime Population by Census Tract. This section provides access to estimates of the daytime population and related measures via interactive table and GIS project. These data are based on the 2013 American Community Survey 5-year estimates (ACS2013). See more about these data below. Visual Analysis of County Employment-Residence Ratio Patterns The following graphic shows patterns of the Employment-Residence (E-R) Ratio by county for the Atlanta area (Atlanta metro bold outline). 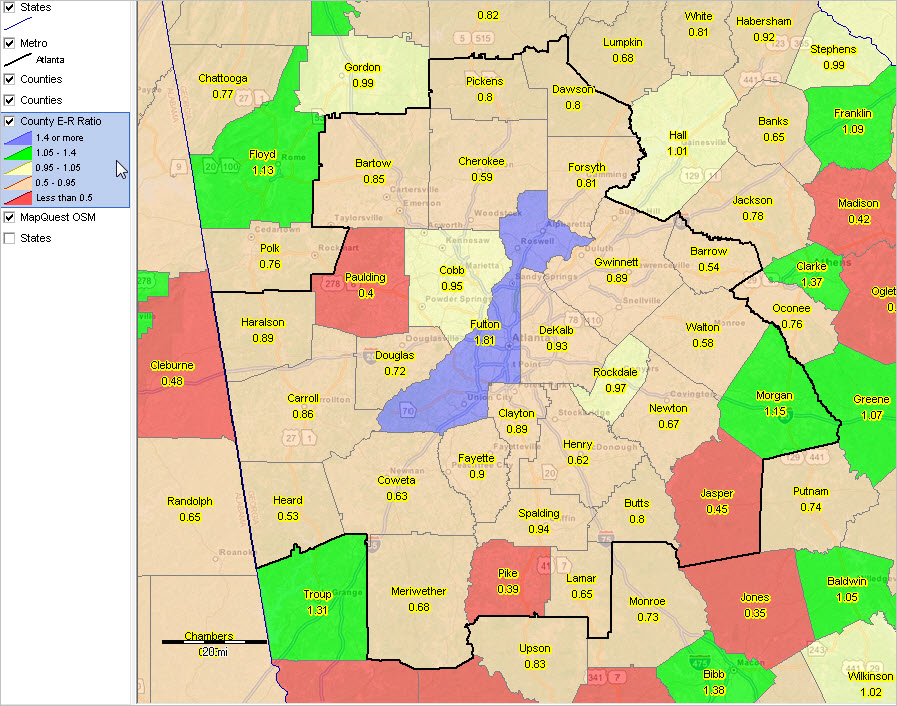 View created with CV XE GIS. Click graphic for larger view. Download GIS project for use on your computer. See details below. About the Employment-Residence (E-R) Ratio The E-R ratio is a measure of the total number of workers working in the area, relative to the total number of workers living in the area. The E-R ratio is used sn indicator of the jobs-workers balance in an area. A value greater than 1.00 shows there are more workers working in the area than living there (net importers of labor). A value of less than 1.00 is shown in areas that send more workers to other areas than they receive (net exporters of labor). View, rank, compare the E-R ratio by state and county using the interactive table below. County-State Daytime Population; ACS 2013 -- Interactive Table See related Ranking Tables Main Page Click column header to sort; click again to sort other direction. Table Usage Notes • Click on a column header to sort on that column; click column header again to sort in other direction. • Use vertical scroll bar (far right) to scroll vertically. • Mouseover column headers to view description of item. • Click ShowAll button to show all areas and restore full set of data view. • Use horizontal scroll bar to view columns to right (such as E-R Ratio). Left 6 columns remain fixed. • Click State (dropdown below table) to view areas in a selected state (click ShowAll between selections). • Right-click a row, then click Copy to copy to clipboard ... then paste to desired application, e.g., spreadsheet. • Find by Name: key in partial area name in text box to right of Find-in-Name button then click button to locate all matches (case sensitive). • See related ranking tables. Definitions Worker -- workers are civilians and members of the Armed Forces, 16 years and over, who were at work the previous week at the time of completing the survey. Persons on vacation or not at work the prior week are not included. Total Area Population/Residents -- the resident population is defined as the number of people living in a specified geography. Total workers working in area -- the total number of workers working in an area includes all workers who indicate a specified area as their place of work regardless of where they live. Total workers living in area -- the total workers living in a specified geography is defined as the number of workers who are also residents. This estimate does not reflect location of work. Columns and Relationships of Measures ResPop Total resident population � total number of persons living in area as shown in ACS. WrkWrk Total workers working in the area � number of workers who reported working in area, regardless of their place of residence. It is the total that worked there no matter where they lived. Residence locations are not considered, only workplace locations are reflected in this number. WrkLiv Total workers living in the area � sometimes referred to as number of resident workers. It is the number of people living in the area who are workers. It includes workers who live there regardless of where they worked, no matter where their workplace was located. Place of work location is not considered, only residence location is reflected in this number. DayPop Estimated daytime population � estimate arrived at by adjusting total resident population by number of incommuters and outcommuters to the area, using data from the American Community Survey. It does not adjust for people entering or leaving the area for purposes other than commuting, nor does commuting adjustment take time of day of the work trips into account. The estimate is calculated by adding the total resident population (ResPop) and the total workers working in the area (WrkWrk), and then subtracting from that result the total workers living in the area (WrkLiv). This method yields the same result as would be obtained by adding the incommuters and subtracting the outcommuters from the total resident population. DayPopCm Daytime population change due to commuting � numeric increase or decrease in population of area as a result of work-related commuting. It is the net change in the population due to work travel and is computed by subtracting the total resident population (ResPop) from the estimated daytime population (DayPop). Positive numbers indicate more commuters entering the area than leaving it. Negative numbers occur when more workers leave the area to go to work than enter it to come to work. %DayPopCm Percent daytime population change due to commuting � percentage increase or decrease in the population of the area as a result of work-related commuting. It is calculated by dividing the numeric change due to commuting (DayPopCm) by the total resident population (ResPop), and multiplying the result by 100. Positive figures denote the percentage increase experienced by the population, negative numbers show the percentage decrease in the population as a result of commuting. WrkSame Workers who lived and worked in the same area � shows how many workers who lived in a particular area also worked in that same area. It is derived from place of residence location information and responses to the question on workplace location during the week prior to filling out the ACS questionnaire. %WrkSame Percent workers who lived and worked in the same area � sometimes used as an indicator of worker retention, but it does not reflect variation in area size or other attributes very well. It is computed by dividing the number of workers who lived and worked in the same area (WrkSame) by the total workers living there (WrkLiv) and multiplying the result by 100. E-R Ratio Employment-residence (E-R) ratio � measure of total number of workers working in the area (WrkWrk), relative to the total number of workers living in the area (WrkLiv). It is often used as a rough indication of the jobs-workers balance in an area, although it does not take into account whether the resident workers possess the skills needed for the jobs that are available. E-R ratios greater than 1.00 occur when there are more workers working in the area than living there. These areas can be considered as net importers of labor. For example, an E-R ratio of 1.19 means that there are 19 percent more workers working in the area than living in the area. Values less than 1.00 indicate areas that send more workers to other areas than they receive, i.e., they are net exporters of labor. Use the State & County Daytime Population GIS Project for Further Analysis 1. Install the ProximityOne CV XE GIS (only required if not already installed) ... run the CV XE GIS installer ... take all defaults during installation 2. Download the State & County Daytime Population GIS project fileset ... requires ProximityOne User Group ID (join now, no fee) ... unzip State & County Daytime Population GIS project files to local folder c:\daytime2013 ... project file may not be redistributed in part or in whole nor used with other software. 3. Open the c:\daytime2013\daytime_pop_2013.gis project ... after completing the above steps, click File>Open>Dialog ... open the file named c:\daytime2013\daytime_pop_2013.gis 4. Done. Start-up view appears similar to map graphic shown at the top of this section. About these Data Data used in this section are based on the 2013 ACS 5-year estimates (centric to mid-2011). ACS 2014 ACS 5-year estimates (ACS2014) were released in December 2015. ACS 2015 ACS 5-year estimates (ACS2015) will be released in December 2016. Support Using these Resources Learn more about demographic economic data and related analytical tools. Join us in a Data Analytics Lab session. There is no fee for these Web sessions. Each informal session is focused on a specific topic. The open structure also provides for Q&A and discussion of application issues of interest to participants. ProximityOne User Group Join the ProximityOne User Group to keep up-to-date with new developments relating to geographic-demographic-economic decision-making information resources. Receive updates and access to tools and resources available only to members. Use this form to join the User Group. Additional Information ProximityOne develops geographic-demographic-economic data and analytical tools and helps organizations knit together and use diverse data in a decision-making and analytical framework. We develop custom demographic/economic estimates and projections, develop geographic and geocoded address files, and assist with impact and geospatial analyses. Wide-ranging organizations use our software, data and methodologies to analyze their own data integrated with other data. Follow ProximityOne on Twitter at www.twitter.com/proximityone. Contact ProximityOne (888-364-7656) with questions about data covered in this section or to discuss custom estimates, projections or analyses for your areas of interest. |
|
|