
|
|
|
Economic Prosperity by ZIP Code Area
Based on the American Community Survey 5-year estimates (ACS), ten ZIP Code Areas had a median household income of $250,000 or more during 2009-13. More than 130 ZIP code areas had a median housing value of $1,000,000 or more. This section reviews measures of economic prosperity for all ZIP code areas. See the list of all ZIP codes showing median household and related measures in the interactive table shown below. Use the interactive table to view, rank, compare and query ZIP code attributes. Location-Based Demographics (LBD) ... • find demographics & geocodes (ZIP code and other) for an address • create area profiles for areas containing address; export to spreadsheet/HTML • start using the Location-Based Demographics tool View Patterns of Economic Prosperity by ZIP Code • thematic maps online with your browser • this view shows patterns of median household income by ZIP code area in the Atlanta metro area • create similar views for areas of interest -- see details  - click graphic for larger view Examining demographic-economic characteristics by ZIP code is important for several reasons. We are familiar with our own ZIP codes as a geographic location. We tend to be interested in our area compared to other areas. ZIP codes provide an easy way to do that. Also, many secondary data resources are tabulated by ZIP code area; some important data are only available by ZIP code. See more about ZIP Code areas. Resources & Methods to Examine Small Area Demographics • See related ZIP Code Demographic-Economic Interactive Tables .. extended subject matter • See related Census Tract Code Demographic-Economic Interactive Tables • Examine ZIP Code Urban/Rural Characteristics • Examine ZIP Code Business Establishment patterns • Examine ZIP Code Housing Price Index patterns • Join us in the weekly Data Analytics Lab Sessions .. reviewing applications using these and related data. Top 100 ZIP Code Areas Based on Median Household Income The following graphic shows locations of the ZIP code areas with the highest median household income. 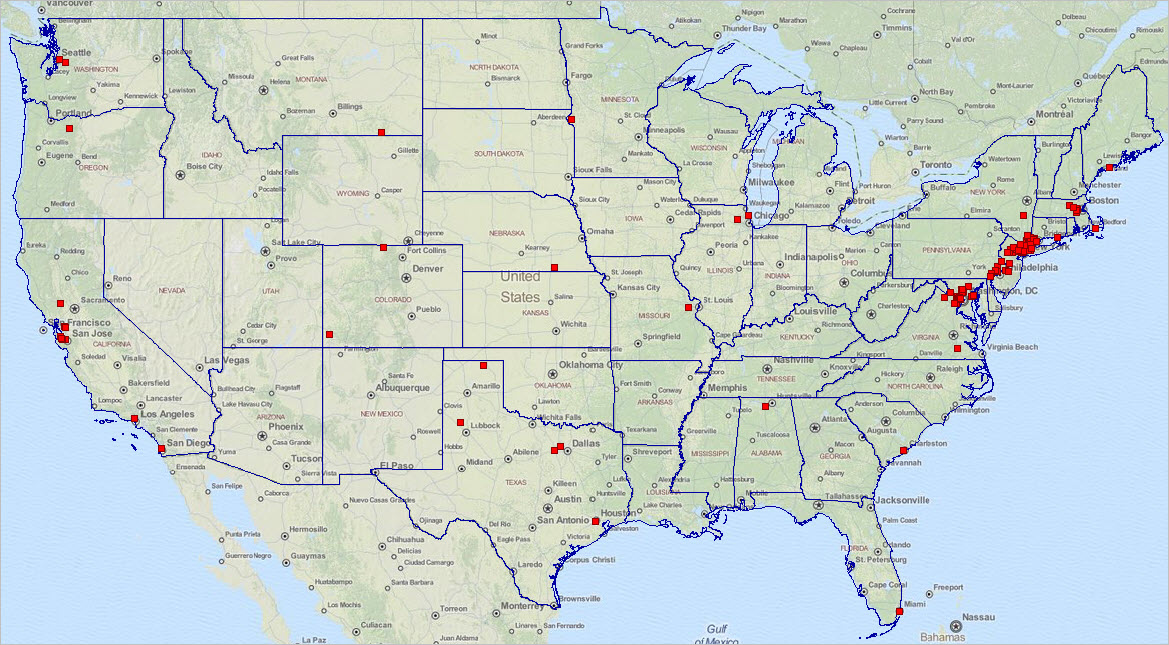 View developed with CV XE GIS software. Click graphic for larger view. Additional views: (click link) • ZIP 77010 (Houston) in context of ZIP code boundary (red boundary) and Open Street Maps ZIP Code Areas: Population & Economic Prosperity -- Interactive Table Table initially sorted by median household income. Use the interactive table shown below to examine attributes of ZIP Code areas. Click column header to sort; again to sort other direction. Usage notes below table. See related demographic-economic interactive pages Usage Notes • Click ShowAll between queries/filters. • Query for 3-digit ZIP Code: Click ShowAll button; replace "100" (no quotes) with 3 digit ZIP; click Find ZIP button. .. performs find for exact match on column 1 (ZIPCode). • Query by city name: Click ShowAll button; replace "Los Angeles" (no quotes) with case sensitive partial/all city name; .. click Find Name button. .. performs find for exact match on column 5 (City Name). • Median household income is top coded at $250,000. Areas showing $250,000 are $250,000 or more. • Median housing value is top coded at $1,000,000. Areas showing $1,000,000 are $1,000,000 or more. • -1 value indicates no estimate available for this area. -666666666 -6 null -9 https://api.census.gov/data/2013/acs/acs5?get=B01001_001E,B19013_001E,B25077_001E&for=zip%20code%20tabulation%20area:* Support Using these Resources Learn more about accessing and using demographic-economic data and related analytical tools. Join us in a Data Analytics Lab session. There is no fee for these one-hour Web sessions. Each informal session is focused on a specific topic. The open structure also provides for Q&A and discussion of application issues of interest to participants. ProximityOne User Group Join the ProximityOne User Group to keep up-to-date with new developments relating to geographic-demographic-economic decision-making information resources. Receive updates and access to tools and resources available only to members. Use this form to join the User Group. Additional Information ProximityOne develops geographic-demographic-economic data and analytical tools and helps organizations knit together and use diverse data in a decision-making and analytical framework. We develop custom demographic/economic estimates and projections, develop geographic and geocoded address files, and assist with impact and geospatial analyses. Wide-ranging organizations use our tools (software, data, methodologies) to analyze their own data integrated with other data. Follow ProximityOne on Twitter at www.twitter.com/proximityone. Contact ProximityOne (888-364-7656) with questions about data covered in this section or to discuss custom estimates, projections or analyses for your areas of interest. |
|
|