
|
|
|
-- data resources & data analytics May 2020 .. the pandemic impact on businesses remains in flux. This section reviews pre-pandemic business establishments and employment patterns and characteristics by ZIP code. By examining pre-pandemic conditions, we can better assess the impact of how and why business, demographic and economic change and impact as we move forward. The magnitude and duration of the impact on businesses will vary by community/area and become more measurable in the months ahead. More about these data. Use tools described in this section to analyze patterns and characteristics of ZIP code business patterns. The interactive table provides data on the characteristics of business establishments for 2016 and 2017 by ZIP code. Use the GIS tools and related GIS project to develop variations of the views shown below. See also: • County Business Patterns • ZIP Codes with largest number of establishments .. see below • Related data resources .. see below Patterns of Manufacturing Establishments by ZIP Code The following graphic shows patterns of the number of manufacturing establishments by ZIP code. The inset legend shows the color/percent pattern. Click the graphic for a larger view. The larger view includes a county layer view. Expand the browser window for the best quality view. Use the CV XE GIS tools and ZIP business patterns database to create views similar to this for any type of business (detail up to 6-digit NAICS level). Examine number of establishments by employment size class. 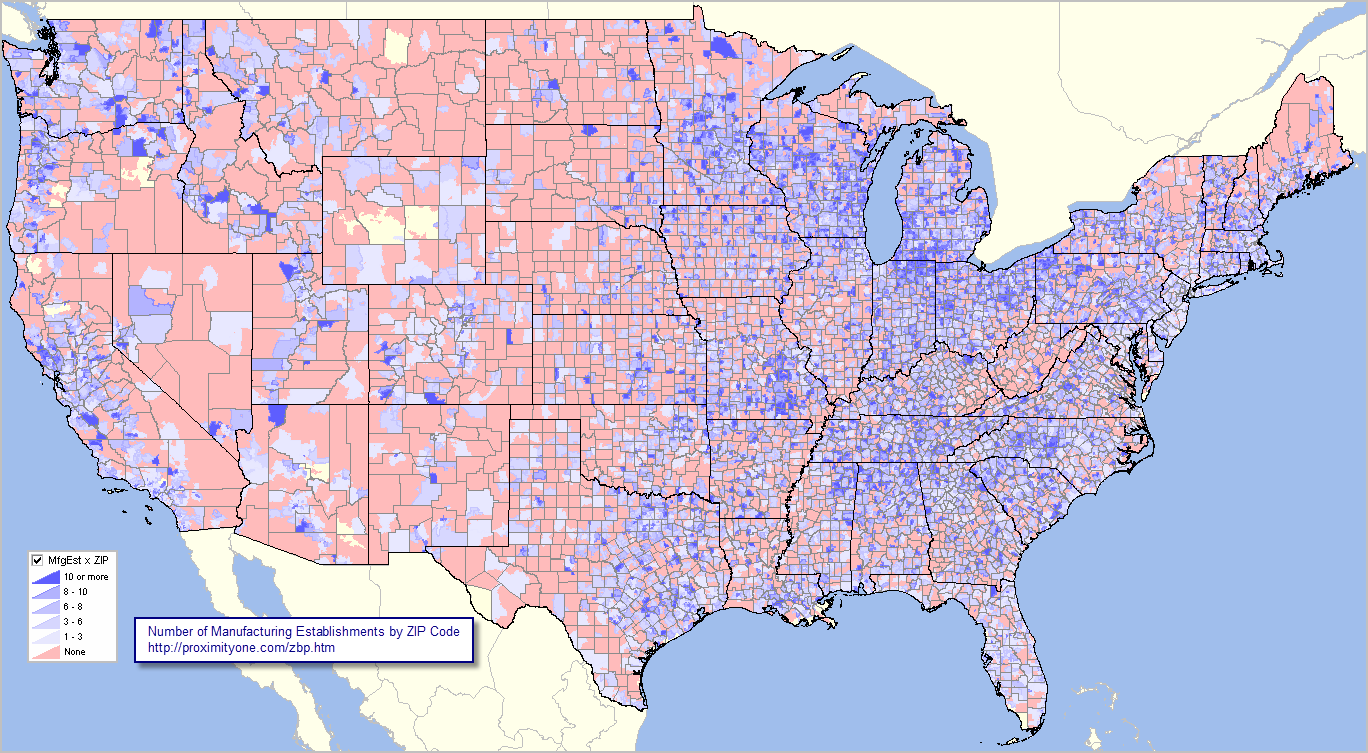 - view developed using ProximityOne CV XE GIS and related GIS project. Zoom-in View of Atlanta Metro & Region The following graphic shows patterns of the number of manufacturing establishments by ZIP code for the Atlanta, GA area. The metro is shown by bold brown boundary. The inset legend shows the color/percent pattern. Counties are shown with black boundary. Click the graphic for a larger view. The larger view shows ZIP codes labeled with the number of manufacturing establishments as a percent of total establishments by ZIP code. Expand the browser window for the best quality view. Use the CV XE GIS tools and ZIP business patterns database to create views integrated with your own data and other geography, such as point locations. Examine any type of business (detail up to 6-digit NAICS level). Examine number of establishments by employment size class. 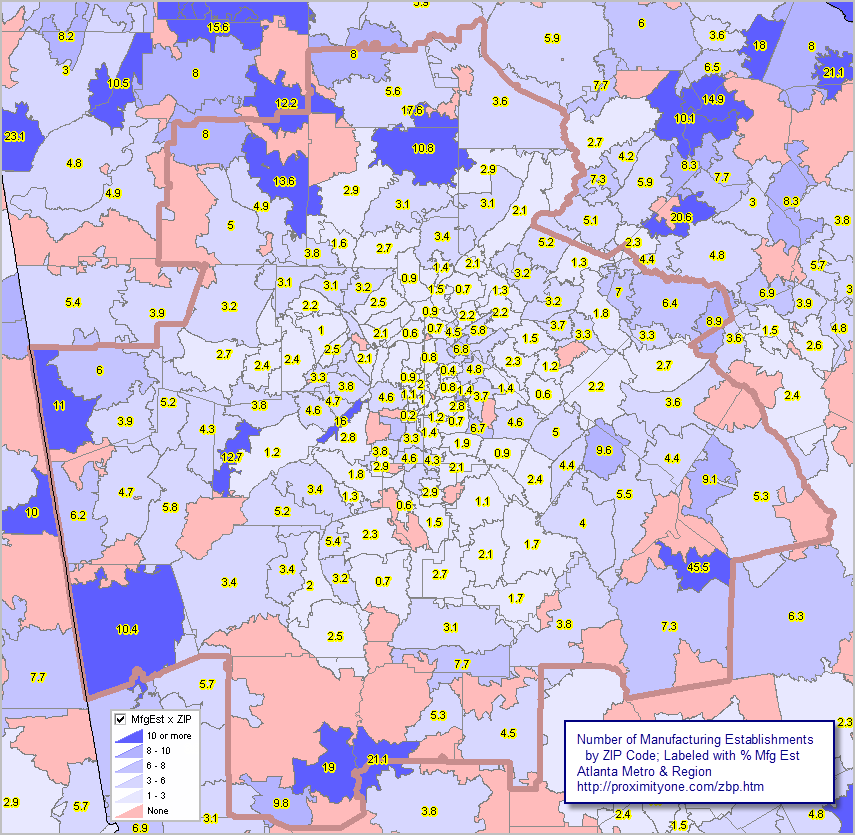 - view developed using ProximityOne CV XE GIS and related GIS project. ZIP Code Business Patterns Interactive Table See usage notes below ranking table. See related interactive tables. Usage Notes • Click on a column header to sort on that column; click column header again to sort in other direction. • Click ShowAll button to show all areas and restore full set of data view. • Click State to view ZIPs in a selected state (click ShowAll between selections). • Find by Name: key in partial area name in text box to right of Find-in-Name button then click button to locate all matches (case sensitive). • See related interactive tables. Column Header Descriptions - ZIP - City - County - St - Establishments -- 2016 - Establishments -- 2017 - Establishments -- 2016-2017 change - Establishments -- 2016-2017 percent change - Employment -- Mid-March 2016 - Employment -- Mid-March 2017 - Employment -- 2016-2017 change - Employment -- 2016-2017 percent change - 1st Quarter Payroll -- 2016 ($000) - 1st Quarter Payroll -- 2017 ($000) - 1st Quarter Payroll -- 2016-2017 change ($000) - 1st Quarter Payroll -- 2016-2017 percent change - Annual Payroll -- 2016 ($000) - Annual Payroll -- 2017 ($000) - Annual Payroll -- 2016-2017 change ($000) - Annual Payroll -- 2016-2017 percent change Compare Selected ZIPs Locate a ZIP/row of interest. Right-click the row; it turns blue; select Copy on dropdown; the row is copied to clipboard. Open Excel or preferred tool. Paste clipboard to a row/cell. Repeat this process for additional ZIP codes. Please reference the source of any use of these data as: ProximityOne and Census Bureau and add the link to this page: http://proximityone.com/zipbusiness.htm. More Detailed Data by ZIP Code -- Type of Business More detailed business establishment characteristics are available by ZIP Code, summarized by NAICS Code.
Patterns of Ambulatory Health Care Services Establishments by ZIP Code: Houston, TX Metro Area The following graphic shows patterns of Ambulatory Health Care Services Establishments by ZIP code in the Houston, TX metro area (bold boundary). Inset legend shows number of establishments to color shown in map. Click graphic for larger view, zoom-in to Harris County. Larger view shows ZIP codes labeled with ZIP code and number Ambulatory Health Care Services Establishments (NAICS 621). The approximate 10,000 "621" establishments in Harris County disaggregate to 133 ZIP codes. How will this mix/distribution change with pandemic?  ZIP Codes with Largest Number of Establishments .. goto top Nine of the top 10 ZIP codes ranked on number of establishments area located in Manhattan (New York County, NY) and have a total of 51,183 establishments and 1.2 million employees with average annual payroll of $117,115. View this ranking by using the interactive table above. The nine ZIP codes are shown in graphic below with yellow ZIP code labels 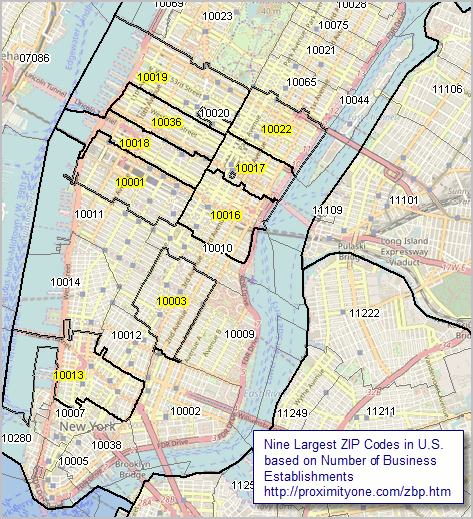 - view developed using ProximityOne CV XE GIS and related GIS project. About ZIP Business Establishments .. goto top Business establishments are the places of employment that drive and characterize the economy. ZIP codes are the smallest geography for which business establishment data are available. ZIP code business patterns data can help stakeholders identify areas of employment, business opportunities and more. While we can obtain employment data (by place of residence) for ZIP code areas from the American Community Survey 5-year estimates (ACS), the number of establishments and employment by place of work are only available from the ZIP business patterns data. The annually updated ZIP business data are derived from a confidential register of businesses maintained by the Census Bureau. The register contains a record for each known establishment in the U.S. with employees. An establishment is a single physical location where business transactions take place and for which payroll and employment records are kept. Unlike sample-based household estimates, such as provided by the American Community Survey 5-year estimates (ACS), the ZIP business patterns data are based on data reported by individual businesses. The individual establishment business data are summarized at the ZIP code, county and for higher level geography. The scope of subject matter is provided in two separate sets of summary data. The "totals" data, as used above in this section, provide data on the total number of establishments, first quarter payroll, employment and annual payroll. The "detailed" data provide summaries for establishments, employment and payroll by industry/business sector (by NAICS codes). Most NAICS industries are included. Crop and animal production (NAICS 111,112), rail transportation (NAICS 482), Postal Service (NAICS 491), pension, health, welfare, and vacation funds (NAICS 525110, 525120, 525190), trusts, estates, and agency accounts (NAICS 525920), private households (NAICS 814), and public administration (NAICS 92) are excluded. While most government establishments are excluded, the following are included: government sponsored wholesale liquor establishments (NAICS 4248), retail liquor stores (NAICS 44531), book publishers (511130), federally-chartered savings institutions (NAICS 522120), federally-chartered credit unions (NAICS 522130), and hospitals (NAICS 622). Related Data .. goto top • Demographic Data by ZIP Code Area - ACS2018 • ZIP Code Area Demographic Interactive Tables (ACS 2016) • County Quarterly Establishments, Employment, Earnings by NAICS ProximityOne User Group Join the ProximityOne User Group to keep up-to-date with new developments relating to metros and component geography decision-making information resources. Receive updates and access to tools and resources available only to members. Use this form to join the User Group. Support Using these Resources Learn more about accessing and using demographic-economic data and related analytical tools. Join us in a Data Analytics Lab session. There is no fee for these one-hour Web sessions. Each informal session is focused on a specific topic. The open structure also provides for Q&A and discussion of application issues of interest to participants. Additional Information ProximityOne develops geodemographic-economic data and analytical tools and helps organizations knit together and use diverse data in a decision-making and analytical framework. We develop custom demographic/economic estimates and projections, develop geographic and geocoded address files, and assist with impact and geospatial analyses. Wide-ranging organizations use our tools (software, data, methodologies) to analyze their own data integrated with other data. Follow ProximityOne on Twitter at www.twitter.com/proximityone. Contact us (888-364-7656) with questions about data covered in this section or to discuss custom estimates, projections or analyses for your areas of interest. |
|
|