
|
|
|
Mapping ZIP Code Demographics
Topics in this section ... • Order ZIP code area profiles and maps. • interactive table to view/query/rank ZIP code demographics. • develop and use a GIS project to create ZIP code thematic maps. • related sections. Median Housing Value by ZIP Code Area; Los Angeles Area Click graphic for larger view. Larger view illustrates use of identify/select tool to show mini profile for a selected ZIP code (see at pointer). Expand browser window for best quality view. 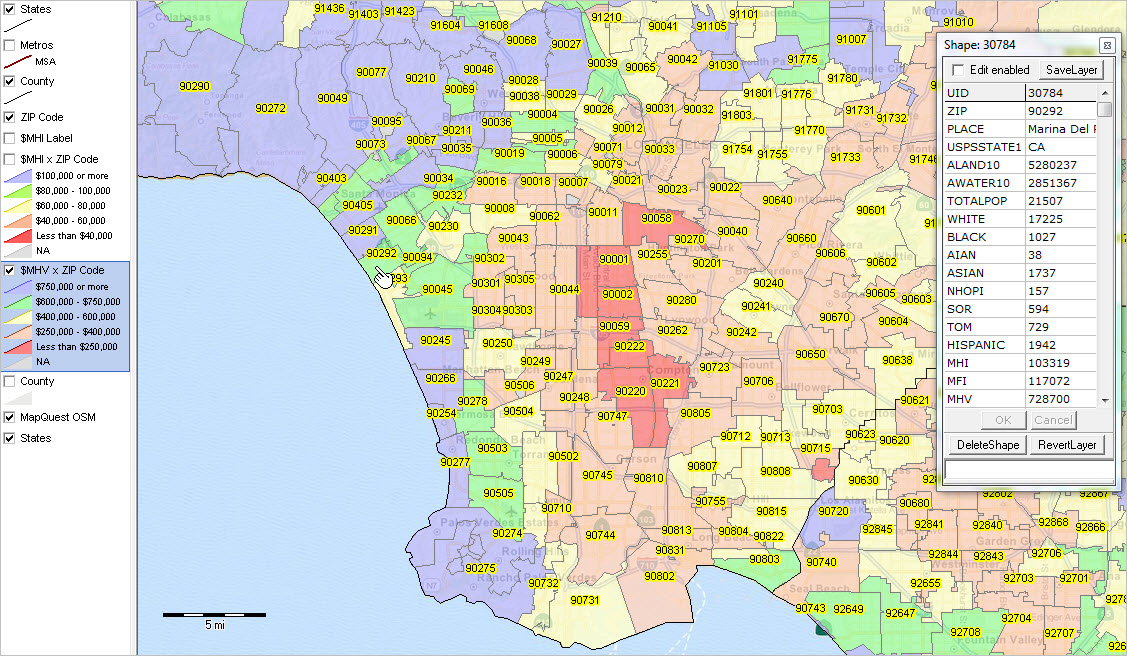 View developed with CV XE GIS software. Median Household Income by ZIP Code Area; Los Angeles Area -- using Mapserver Click graphic for larger view. Larger view illustrates shows legend and mini profile (attributes) for a selected ZIP code (see at pointer). Expand browser window for best quality view. -- creat a similar map for any area using the VDA Mapserver.  View developed with VDA Mapserver. ZIP Code Area Demographic-Economic Characteristics -- Interactive Table ... goto top Use the interactive table shown below to examine attributes of ZIP Code areas. Click column header to sort; again to sort other direction. Usage notes below table. See related Interactive Tables Order the Data Shown in Table in Excel Format
• Click ShowAll between queries/filters. • Query for 5-digit ZIP Code: Click ShowAll button: -- replace "85258" (no quotes) with 5 digit ZIP; click Find ZIP button. -- performs find for exact match on column 1 (ZIPCode). Columns & Subject Matter Items -- table and ZIP Code layer in GIS Project. - ZIP Code - City Name - State USPS - State County FIPS code - Land area SQMI - Water area SQMI - D001 - Total Population - D031 - Population - One Race - D032 - Population - White alone - D033 - Population - Black alone - D034 - Population - American Indian/Alaska Native alone - D039 - Population - Asian alone - D040 - Population - Asian Indian alone - D047 - Population - Native Hawaiian/Other Pacific Islander alone - D052 - Population - Other race - D053 - Population - Two+ races - D066 - Population - Hispanic (of any race) - E062 - $Median Household Income - E086 - $Median Family Income - H001 - Housing Units - H002 - Occupied Units - H003 - Vacant Units - H089 - $Median Housing Value All subject matter items based on the 2017 American Community Survey (ACS 2017) 5-year estimates. • Median household income is top coded at $250,000. Areas showing $250,000 are $250,000 or more. • Median housing value is top coded at $2,000,000. Areas showing $2,000,000 are $1,000,000 or more. • -1 value indicates no estimate available for this area. Mapping ZIP Code Demographics ... goto top Follow these steps to use the CV XE GIS software to access ZIP code demographic economic data and create thematic maps using those data. All steps described below can be performed without cost. Terms of use. Data and software are provided for your use only. The software nor data may be redistributed. Application results (maps, graphics, tables, etc.) may be used in stories, reports and similar documents including publication on the Web. All usage should show reference use of ProximityOne resources and include a link to this Web page. There is no warranty of any type regarding any aspect of this section or any aspect of the software and related data. Installation of the resources requires Windows computer and Internet connection. 1. Install the ProximityOne CV XE GIS. See related User Guide. ... if you already have CV XE GIS on your computer, skip step 1. ... run the CV XE GIS installer ... take all defaults during installation You need two files: ... subject matter data file (item 2 below) ... shapefile ... acquire file (item 3 below) Next integrate the subject matter data into the shapefile (item 4 below) Next add the shapefile to a GIS project(item 5 below) 2. Get the ZIP code demographic-economic data of interest. ... with CV XE GIS running, use File>APIGateway (see about operation) ... see about subject matter selections/options (opens xlsx file) 3. Get the U.S. by ZIP code shapefile ... with CV XE GIS running, use File>GeoGateway (see about operation) 4. Integrate subject matter (2 above) into shapefile (3 above). ... with CV XE GIS running, use File>Database>DBMerge (see about operation) 5. Add the shapefile (updated in step 4 above) to a GIS project. ... we suggest using the default US1.GIS project. Join the the weekly Data Analytics Web Sessions ... get questions answered and how-to assistance. Using ZIP Code Layer Starting from step 5 above ... 1. Labeling ZIP Code Areas In the legend panel to left of map window, • optionally click check box to show layer named "ZIP Code" in map window. - this makes the ZIP code visible as a label in the ZIP code area polygon. • optionally click check box to show layer named "$MHI Label" in map window. - this makes the $MHI value visible as a label in the ZIP code area polygon. These labels work well when fewer than approximately 100 ZIP codes are shown in the map window. 2. Navigating to Different Regions> To accelerate navigation steps, turn off (uncheck) the ZIP code layers; then once in the county/region of interest rec-check the ZIP code layer(s). Drag Map. Set the mouse to drag mode - click hand in the tool bar above the map. - click the map window, hold mouse down and drag to preferred location. Zoom-in or -out. Set the mouse to Zoom by Window mode - click magnifying glass in tool bar above map. - zoom-in: click mouse down in map window to be the new upper left of the "zoom-to" region. - hold mouse down and drag to lower right of the new lower right of the "zoom-to" region". - to zoom-out, reverse the process, starting at lower right and dragging to upper left. 3. View Attributes of an Area . Set the mouse to Select Mode - click pointer in tool bar above map. - click once on the name of a layer in the legend panel. - the layer section in the legend panel turns blue; this is now the "active layer". - click any geographic object of interest; e.g., ZIP code area for the ZIP code layer. - a mini-profile now displays showing the attributes of this geography. - the mini-profile content is copied to clipboard; it may be pasted in a spreadsheet or other application. 4. Setting Queries on Layers See CV XE GIS Layer Editor to modify attributes of layer settings. Start the Layer Editor by dbl-clicking the layer name in the legend panel. The "$MHI x ZIP Code" initial layer settings are shown below. Click graphic for larger view. 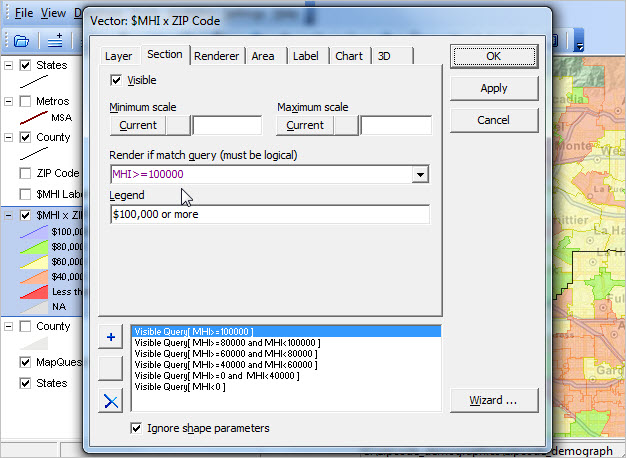 This view shows (clicking Section tab on Layer Editor form) that the topmost interval/section will display area attributes for this section when the SQL-like query "MHI>=100000" exists. The Legend panel value for this interval will display as "$100,000 or more". In this settings for this layer there are 6 intervals defined. Clicking the Area tab on Layer Editor form, the next view shows how the fill pattern, boundary and colors are set. 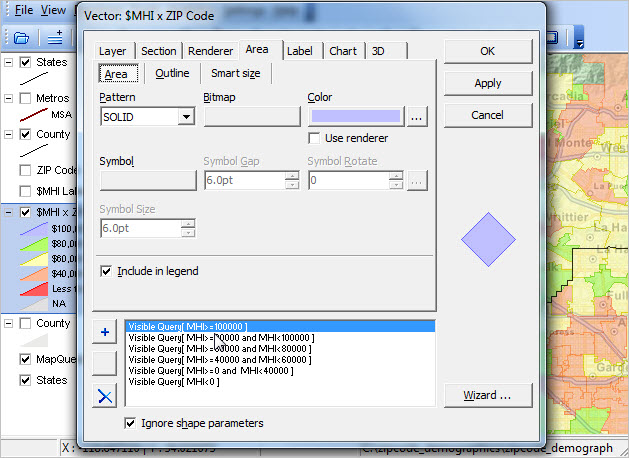 Related Sections ... goto top • Business Establishment Characteristics by ZIP Code by Type of Business • Housing Price Index by ZIP Code • Bank Locations/Characteristics by ZIP Code • ZIP Code Urban/Rural Demographics • Demographics-Economic 5-year Trends • Demograpic-Economic Characteristics: General Demographics .. Social Characteristics .. Economic Characteristics .. Housing Characteristics • ZIP Code <-> Census Tract relationship & equivalencing • ZIP Code <-> Block Group relationship & equivalencing ProximityOne User Group ... goto top Join the ProximityOne User Group to keep up-to-date with new developments relating to metros and component geography decision-making information resources. Receive updates and access to tools and resources available only to members. Use this form to join the User Group. Support Using these Resources Learn more about accessing and using demographic-economic data and related analytical tools. Join us in a Data Analytics Lab session. There is no fee for these one-hour Web sessions. Each informal session is focused on a specific topic. The open structure also provides for Q&A and discussion of application issues of interest to participants. Additional Information ProximityOne develops geodemographic-economic data and analytical tools and helps organizations knit together and use diverse data in a decision-making and analytical framework. We develop custom demographic/economic estimates and projections, develop geographic and geocoded address files, and assist with impact and geospatial analyses. Wide-ranging organizations use our tools (software, data, methodologies) to analyze their own data integrated with other data. Follow ProximityOne on Twitter at www.twitter.com/proximityone. Contact us (888-364-7656) with questions about data covered in this section or to discuss custom estimates, projections or analyses for your areas of interest. |
|
|