ZIP Code Areas & Demographic-Economic Data

Contents
Examining ZIP Code Areas & Demographic-Economic Characteristics
Use the cloud-based Virtual Data Analytics (VDA) Mapserver
... view/analyze ZIP code areas in context of other types of geographic areas
... examine ZIP Code demographic-economic characteristics
... access now; now fee; start link and details on above page
September 2020 -- ZIP Code Multi-Sourced Demographic-Economic-Business Profiles
... accessing and using Demographic-Economic Profile datasets and reports (new September 2020)
... ZIP Code ACS 2018 demographic-economic profile interactive tables
- General Demographics - http://proximityone.com/zip18dp1.htm
- Social Characteristics - http://proximityone.com/zip18dp2.htm
- Economic Characteristics - http://proximityone.com/zip18dp3.htm
- Housing Characteristics - http://proximityone.com/zip18dp4.htm
... structured profiles for individual ZIP codes; updating as new data become available
... HPI and ZIP Business Patterns establishment data by 3-digit NAICS/type of business
- full 6-digit NAICS detail for Health Services sector
... integrated map graphic relating ZIP code and census tract boundaries
... selection of ZIP code profiles; pick from list -- http://proximityone.com/mapping_zipcode_demographics.htm#table
- example: ZIP 67206 (Wichita, KS) http://proximityone.com/profiles/1/zipprofile67206.htm
Map graphic included in profile. The following graphic shows ZIP code 67206 with a bold red boundary.
- Census tracts are shown with black boundaries and patterns of median household income.
- Not all maps show tracts.
- Some graphics show cities/places with blue cross-hatch pattern.
- view created with CV XE GIS software and related GIS project.
February 2018 -- new/updated ZIP Code area demographic-economic data resources
... find/rank/compare ZIP codes by patterns of economic prosperity
... examine ZIPs by county, metro or state ... or among all U.S.
- General Demographics - http://proximityone.com/zip16dp1.htm
- Social Characteristics - http://proximityone.com/zip16dp2.htm
- Economic Characteristics - http://proximityone.com/zip16dp3.htm
- Housing Characteristics - http://proximityone.com/zip16dp4.htm
December 2016 -- new/updated ZIP Code area demographic-economic data resources
... ZIP Code Demographic Economic characteristics -- http://proximityone.com/zip2015.htm
... find/rank/compare ZIP codes by patterns of economic prosperity
| • | General Demographics - http://proximityone.com/zip14dp1.htm |
| • | Social Characteristics - http://proximityone.com/zip14dp2.htm |
| • | Economic Characteristics - http://proximityone.com/zip14dp3.htm |
| • | Housing Characteristics - http://proximityone.com/zip14dp4.htm |
August 2016 -- Housing Price Index by 5-Digit ZIP Code
| • | interactive table, GIS resource, datasets, profiles, custom analyses |
| • | use tools and methods to access/analyze ZIP code characteristics anywhere in U.S. |
May 2016 -- Retail Trade Sales by ZIP code
| • | interactive table, GIS resource, datasets, profiles, custom analyses |
| • | use tools and methods to access/analyze ZIP code characteristics anywhere in U.S. |
April 2016 -- new .. tips for accessing and analyzing ZIP code
| • | alternative methods of accessing ZIP code demographic-economic data |
| • | use tools and methods to access/analyze ZIP code characteristics anywhere in U.S. |
March 2016 -- new .. SiteReport
| • | custom demographic-economic site reports -- http://proximityone.com/sitereport.htm |
| • | analyze your markets; compare service areas |
| • | custom site report development services & SiteReport software |
January 2016 -- new .. Business Establishment Characteristics by ZIP Code
| • | interactive tables & GIS applications -- http://proximityone.com/zbp.htm |
December 2015 -- new/updated ZIP Code area demographic-economic data resources
| • | ACS 2014 interactive tables & GIS datasets/applications. |
| • | General Demographics - http://proximityone.com/zip14dp1.htm |
| • | Social Characteristics - http://proximityone.com/zip14dp2.htm |
| • | Economic Characteristics - http://proximityone.com/zip14dp3.htm |
| • | Housing Characteristics - http://proximityone.com/zip14dp4.htm |
November 2015 -- 2015 Housing Price Index by ZIP Code
| • | 2014Q3 through 2015Q3; updates quarterly. |
November 2015 -- Relating Block Groups to ZIP Codes
| • | interactive table all block groups and associated ZIP code area intersections. |
October 2015 -- Mapping ZIP Code Demographics
| • | use the no fee CV XE GIS tools with no fee national scope ZIP Code demographics GIS project |
| • | create thematic map views for a county or region; analyze demographic pattern s by ZIP code |
| • | get started now ... http://proximityone.com/mapping_zipcode_demographics.htm |
August 2015 -- Location-Based Demographic-Economic Characteristics
| • | enter address, get geographic-demographic-economic profile |
| • | interactive API-based data access & display tool |
June 2015 -- Create your own ZIP Code Demographic-Economic Profile(s)
Examples of demographic-economic profiles in HTML format (excel an option):
ZIP Code 77019 (sample for Houston, TX area)
Create corresponding profiles for other related geography:
| o | census tract -- Census Tract 48201411100 (Houston, TX area) |
| o | city/place -- San Antonio, TX city |
| o | county -- Harris County, TX (Houston area) |
| o | school district -- Austin ISD, TX |
See more about the Outlook2020 tools and data -- http://proximityone.com/outlook2020dep.htm
Order custom profiles:
| o | Use contact form -- http://proximityone.com/contact.htm -- enter note in text section |
| o | Call 888.364.7656 |
April 2015 -- ZIP Code Business Patterns
March 2015 -- Single Year of Age Demographics
| • | Creating custom age by gender by race/origin profiles by ZIP Code |
View illustrative ZIP Code area age by race/origin demographic profiles: (scroll section)
• 22305 Alexandria, VA
• 28212 Mecklenburg County, NC
• 33426 Palm Beach County, FL
• 48214 Wayne County, MI
• 50125 Warren County, IA
• 53705 Dane County, WI
• 60647 Cook County, IL
• 64112 Jackson County, MO
• 64772 Vernon County, MO
• 66749 Allen County, KS
• 77077 Harris County, TX
• 80909 El Paso County, CO
• 84115 Salt Lake County, UT
• 85258 Maricopa County, AZ
• 87501 Santa Fe County, NM
• 89104 Clark County, NV
• 90210 Los Angeles County, CA
• 92037 San Diego County, CA
• 90210 Los Angeles County, CA
• 96815 Honolulu County, HI
• 97201 Multnomah County, OR
• 98007 King County, WA
February 2015 -- New Guide to ZIP Code Area Demographic-Economic Data Resources
December 2014 -- Economic Prosperity by ZIP Code Area -- http://proximityone.com/acs0913_zips.htm
December 2014 -- ACS 2013 ZIP Code DE1-DE4 datasets (excel/csv/dbase) now available
... order ZIP code area datasets described below here
AGE AND GENDER
D001 Total population D002 Male D003 Female D004 Under 5 years D005 5 to 9 years D006 10 to 14 years D007 15 to 19 years D008 20 to 24 years D009 25 to 34 years D010 35 to 44 years D011 45 to 54 years D012 55 to 59 years D013 60 to 64 years D014 65 to 74 years D015 75 to 84 years D016 85 years and over D017 Median age (years) D018 18 years and over D019 21 years and over D020 62 years and over D021 65 years and over D022 18 years and over D023 Male D024 Female D025 65 years and over D026 Male D027 Female RACE D028 Total population D029 One race D030 Two or more races D031 One race D032 White D033 Black or African American D034 American Indian and Alaska Native D035 Cherokee tribal grouping D036 Chippewa tribal grouping D037 Navajo tribal grouping D038 Sioux tribal grouping D039 Asian D040 Asian Indian D041 Chinese D042 Filipino D043 Japanese D044 Korean D045 Vietnamese D046 Other Asian D047 Native Hawaiian and Other Pacific Islander D048 Native Hawaiian D049 Guamanian or Chamorro D050 Samoan D051 Other Pacific Islander D052 Some other race D053 Two or more races D054 White and Black or African American D055 White and American Indian and Alaska Native D056 White and Asian D057 Black or African American and American Indian and Alaska Native Race alone or in combination with one or more other races D058 Total population D059 White D060 Black or African American D061 American Indian and Alaska Native D062 Asian D063 Native Hawaiian and Other Pacific Islander D064 Some other race HISPANIC OR LATINO AND RACE D065 Total population D066 Hispanic or Latino (of any race) D067 Mexican D068 Puerto Rican D069 Cuban D070 Other Hispanic or Latino D071 Not Hispanic or Latino D072 White alone D073 Black or African American alone D074 American Indian and Alaska Native alone D075 Asian alone D076 Native Hawaiian and Other Pacific Islander alone D077 Some other race alone D078 Two or more races D079 Two races including Some other race D080 Two races excluding Some other race, and Three or more races D081 Total housing units
EMPLOYMENT STATUS
E001 Population 16 years and over E002 In labor force E003 Civilian labor force E004 Employed E005 Unemployed E006 Armed Forces E007 Not in labor force E008 Civilian labor force E009 Percent Unemployed E010 Females 16 years and over E011 In labor force E012 Civilian labor force E013 Employed E014 Own children under 6 years E015 All parents in family in labor force E016 Own children 6 to 17 years E017 All parents in family in labor force COMMUTING TO WORK E018 Workers 16 years and over E019 Car, truck, or van -- drove alone E020 Car, truck, or van -- carpooled E021 Public transportation (excluding taxicab) E022 Walked E023 Other means E024 Worked at home E025 Mean travel time to work (minutes) OCCUPATION E026 Civilian employed population 16 years and over E027 Management, business, science, and arts occupations E028 Service occupations E029 Sales and office occupations E030 Natural resources, construction, and maintenance occupations E031 Production, transportation, and material moving occupations INDUSTRY E032 Civilian employed population 16 years and over E033 Agriculture, forestry, fishing and hunting, and mining E034 Construction E035 Manufacturing E036 Wholesale trade E037 Retail trade E038 Transportation and warehousing, and utilities E039 Information E040 Finance and insurance, and real estate and rental and leasing E041 Professional, scientific, and management, and administrative and waste management services E042 Educational services, and health care and social assistance E043 Arts, entertainment, and recreation, and accommodation and food services E044 Other services, except public administration E045 Public administration CLASS OF WORKER E046 Civilian employed population 16 years and over E047 Private wage and salary workers E048 Government workers E049 Self-employed in own not incorporated business workers E050 Unpaid family workers INCOME AND BENEFITS (IN 2010 INFLATION-ADJUSTED DOLLARS) E051 Total households E052 Less than $10,000 E053 $10,000 to $14,999 E054 $15,000 to $24,999 E055 $25,000 to $34,999 E056 $35,000 to $49,999 E057 $50,000 to $74,999 E058 $75,000 to $99,999 E059 $100,000 to $149,999 E060 $150,000 to $199,999 E061 $200,000 or more E062 Median household income (dollars) E063 Mean household income (dollars) E064 With earnings E065 Mean earnings (dollars) E066 With Social Security E067 Mean Social Security income (dollars) E068 With retirement income E069 Mean retirement income (dollars) E070 With Supplemental Security Income E071 Mean Supplemental Security Income (dollars) E072 With cash public assistance income E073 Mean cash public assistance income (dollars) E074 With Food Stamp/SNAP benefits in the past 12 months E075 Families E076 Less than $10,000 E077 $10,000 to $14,999 E078 $15,000 to $24,999 E079 $25,000 to $34,999 E080 $35,000 to $49,999 E081 $50,000 to $74,999 E082 $75,000 to $99,999 E083 $100,000 to $149,999 E084 $150,000 to $199,999 E085 $200,000 or more E086 Median family income (dollars) E087 Mean family income (dollars) E088 Per capita income (dollars) E089 Nonfamily households E090 Median nonfamily income (dollars) E091 Mean nonfamily income (dollars) E092 Median earnings for workers (dollars) E093 Median earnings for male full-time, year-round workers (dollars) E094 Median earnings for female full-time, year-round workers (dollars) HEALTH INSURANCE COVERAGE E095 .. Civilian Noninstitutionalized Population E096 .... With health insurance coverage E097 ...... With private health insurance coverage E098 ...... With public health coverage E099 .... No health insurance coverage E100 .... Civilian Noninstitutionalized Population Under 18 years E101 ...... No health insurance coverage E102 .... Civilian noninstitutionalized population 18 to 64 years E103 ...... In labor force: E104 ........ Employed: E105 .......... With health insurance coverage E106 ............ With private health insurance E107 ............ With public coverage E108 .......... No health insurance coverage E109 ........ Unemployed: E110 .......... With health insurance coverage E111 ............ With private health insurance E112 ............ With public coverage E113 .......... No health insurance coverage E114 ...... Not in labor force: E115 ........ With health insurance coverage E116 .......... With private health insurance E117 .......... With public coverage E118 ........ No health insurance coverage PERCENTAGE OF FAMILIES AND PEOPLE WHOSE INCOME IN THE PAST 12 MONTHS IS BELOW THE POVERTY LEVEL E119 All families E120 With related children under 18 years E121 With related children under 5 years only E122 Married couple families E123 With related children under 18 years E124 With related children under 5 years only E125 Families with female householder, no husband present E126 With related children under 18 years E127 With related children under 5 years only E128 All people E129 Under 18 years E130 Related children under 18 years E131 Related children under 5 years E132 Related children 5 to 17 years E133 18 years and over E134 18 to 64 years E135 65 years and over E136 People in families E137 Unrelated individuals 15 years and over |
Demographic-economic data by ZIP Code Area (ZCA) ...
See national scope ZCA interactive ranking tables:
| • | General Demographics -- http://proximityone.com/zip12dp1.htm |
| • | Social Characteristics -- http://proximityone.com/zip12dp2.htm |
| • | Economic Characteristics -- http://proximityone.com/zip12dp3.htm |
| • | Housing Characteristics -- http://proximityone.com/zip12dp4.htm |
More about the ZIP Code Demographic-Economic Data Resources -- http://proximityone.com/zipdata.htm.
August 2013 ... Examining ZIP Code Business Characteristics
... 2001 and 2011 business establishments by ZIP Code
... Interactive analysis table: establishments, employment, payroll
... Employer reported data; examine in context with demographics
-- see http://proximityone.com/zipbusiness.htm
August 2013 ... Mapping ZIP Code Areas of Interest
Create custom maps showing ZIP Code areas in context with OpenStreetMap and roads/streets.
... View ZIP Code areas in context of counties and metros.
... Optionally add political areas (e.g., cities, counties, congressional districts, other) to map view.
... Optionally add statistical areas (e.g. census tracts, census blocks, metros, other) to map view.
... Optionally integrate demographic-economic data for thematic mapping and pattern analysis.
... Start using the CV XE GeoGateway feature:
-- about GeoGateway ... http://proximityone.com/cvxe/guide/menu_file_geogateway.htm
-- run CV XE installer ... http://proximityone.com/cv.htm
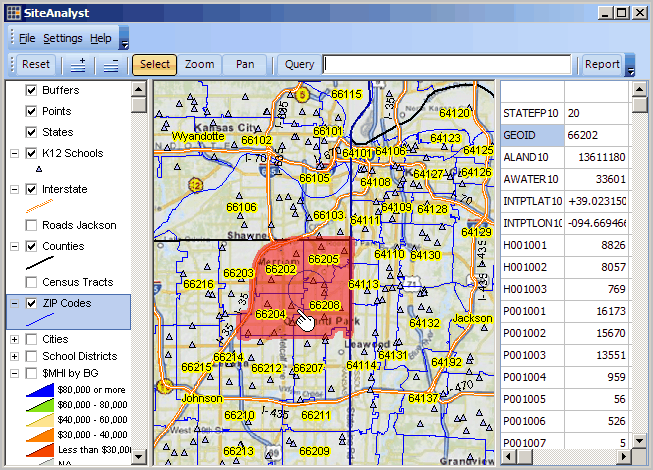
May 2013 ... Using Site Analysis tools to compare/aggregate ZIP Code area demographic-economic characteristics
Map view below illustrates SiteAnalyst to examine four ZIP code areas in Kansas City metro.
... more about this GIS project -- http://proximityone.com/cv_kansascity.htm.
... more about using SiteAnalyst resources -- http://proximityone.com/cv_siteanalysis.htm (operates with any geography/data)
... grid right of map shows data column for each ZIP; clicking Report button generates summary report (xls and HTML).
December 2012 ... new demographic-economic data by ZIP Code Area (ZCA) ...
See national scope ZCA interactive ranking tables:
| • | General Demographics -- http://proximityone.com/zipdp1.htm |
| • | Social Characteristics -- http://proximityone.com/zipdp2.htm |
| • | Economic Characteristics -- http://proximityone.com/zipdp3.htm |
| • | Housing Characteristics -- http://proximityone.com/zipdp4.htm |
More about the ZIP Code Demographic-Economic Data Resources -- http://proximityone.com/zipdata.htm.
Scope & Use of ZCTAs. ZCTAs are defined by allocating each census block that contains addresses to a single ZCTA that reflects the most frequently occurring ZIP Code for the addresses within that tabulation block. Blocks that do not contain addresses but are completely surrounded by a single ZCTA are assigned to the surrounding ZCTA; those surrounded by multiple ZCTAs are added to a single ZCTA based on limited buffering performed between multiple ZCTAs. The ZCTA five-digit code represents the most frequently occurring USPS ZIP Code within that ZCTA. There are significant changes to the 2010 ZCTAs delineation from that used in Census 2000. For 2010 only legitimate five-digit areas are defined so there is no longer full national scope coverage. The 2010 ZCTAs better represent the actual Zip Code service areas because the Census Bureau initiated a process before creation of 2010 blocks to add block boundaries that split polygons with large numbers of addresses using different ZIP Codes. |

Join the conversation .. ProximityOne on Twitter. -- https://twitter.com/ProximityOne
The toggle graphic -- ![]() -- indicates an expanding section. Click the toggle or toggle line to view/close expanding sections.
-- indicates an expanding section. Click the toggle or toggle line to view/close expanding sections.
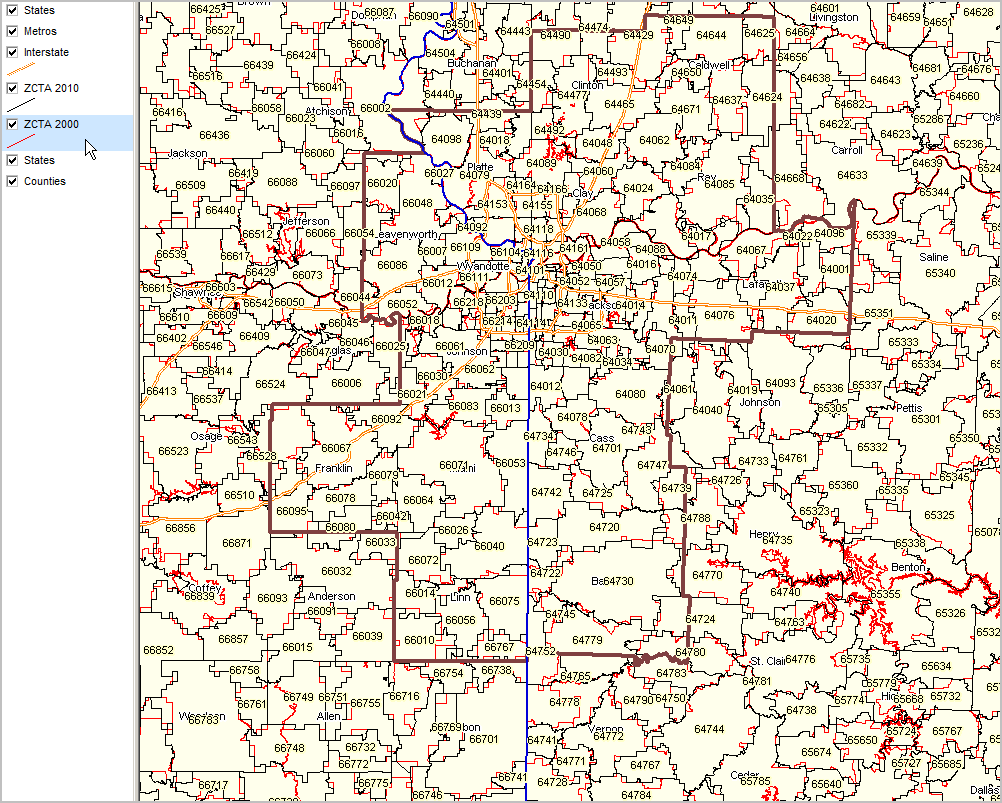
Kansas City MSA bold brown boundary Census 2010 ZCTAs shown with labels
|

View similar to above showing Census 2000 ZCTAs with red boundaries
|
| Zoom-in View to Overland Park KS Area: Census Blocks & ZCTAs |
Census 2010 ZCTAs blue bold boundary with yellow ZIP code label. Thematic map showing patterns of Census 2010 total population by census block (shades of green .. see interval definitions at left of map)
|

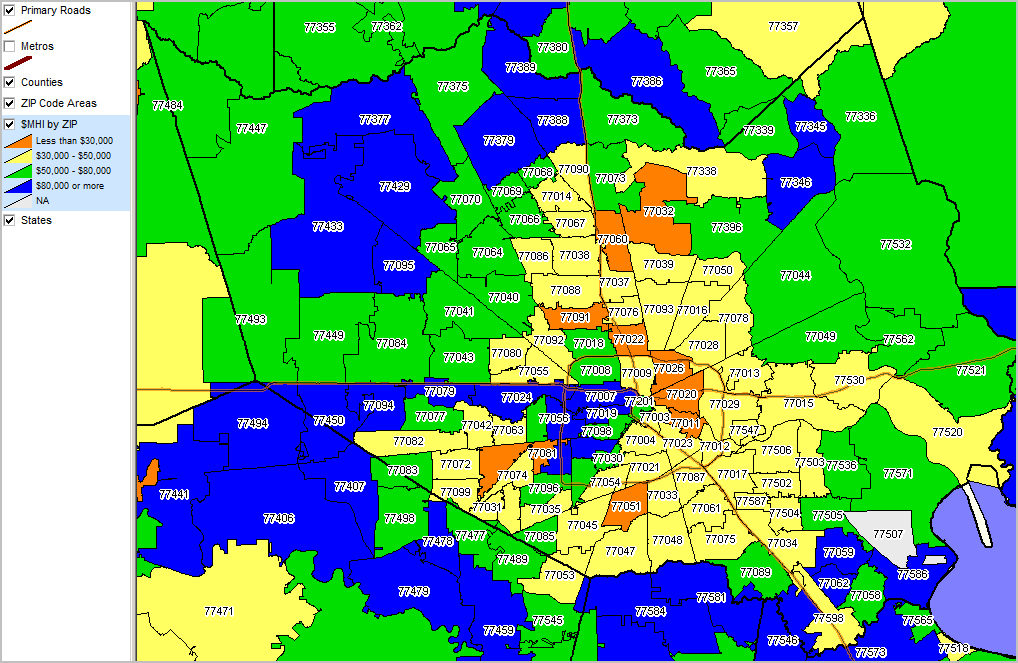
Patterns of Economic Prosperity by ZIP Code Area -- Houston, TX area
Median household Income (ACS 2011) by ZIP Code Area