
|
|
|
Single Year of Age Demographics
Atlanta Metro; Population Age 0 per 1,000 Population by ZIP Code Area 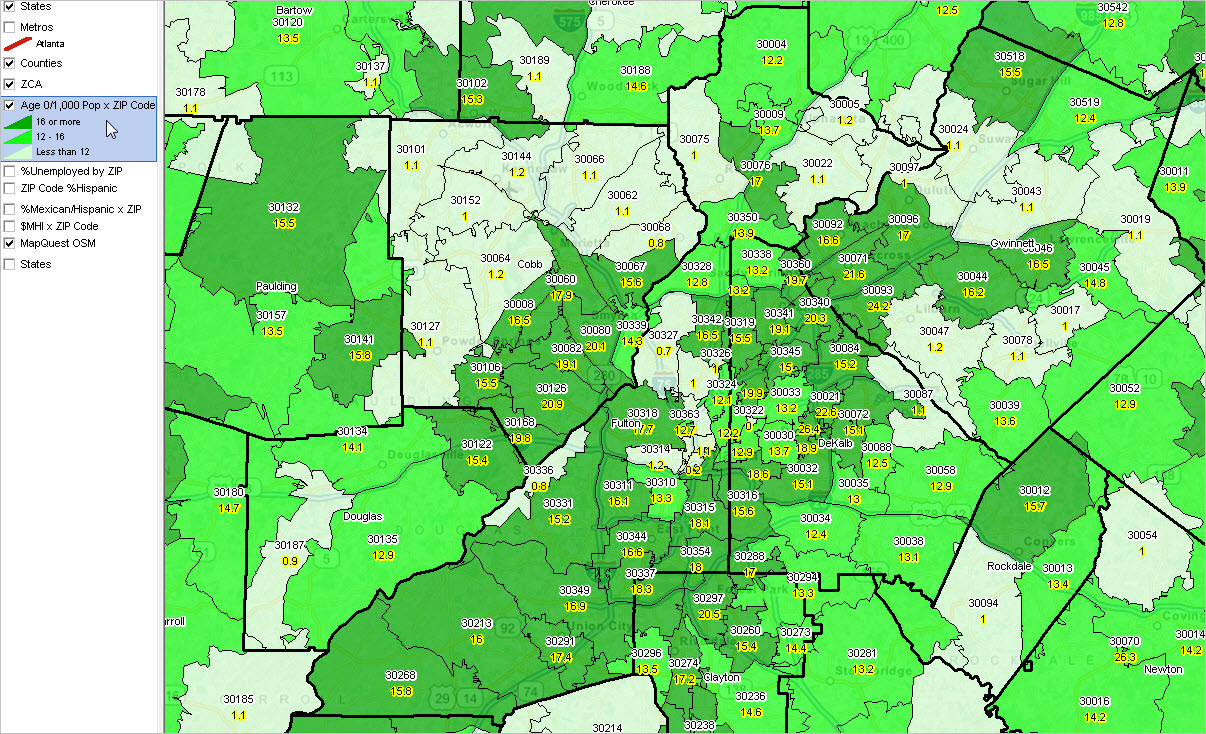 Crude birth rate approximation: population age 0 relative to 1,000 population (2010) Darker green: rate 16 or more; medium green: rate 12-16; light green: less than 12 Click graphic for larger view, zoom-in, labeled with ZIP codes and rate. View developed with CV XE GIS. ZIP Code Area Detailed Age-Race/Origin Profiles View illustrative ZIP Code area SYOA demographic profiles: (scroll section)
• 10021 New York County, NY
• 11222 Kings County/Brooklyn, NY • 20850 Montgomery County, MD • 22305 Alexandria, VA • 28212 Mecklenburg County, NC • 33426 Palm Beach County, FL • 48214 Wayne County, MI • 50125 Warren County, IA • 53705 Dane County, WI • 60647 Cook County, IL • 64112 Jackson County, MO • 64772 Vernon County, MO • 66749 Allen County, KS • 67214 Sedgwick County, KS • 72712 Benton County, AR • 75205 Dallas County, TX • 77077 Harris County, TX • 77375 Harris County, TX • 78207 Bexar County, TX • 80909 El Paso County, CO • 84115 Salt Lake County, UT • 85258 Maricopa County, AZ • 87501 Santa Fe County, NM • 89104 Clark County, NV • 90210 Los Angeles County, CA • 92037 San Diego County, CA • 90210 Los Angeles County, CA • 96815 Honolulu County, HI • 97201 Multnomah County, OR • 98007 King County, WA Using SYOA Demographics Except for possibly the single year of age 0, less than one year of age, single year of age demographics are intrinsically not in high demand. The fact that the single year of age demographics can be aggregated to standardized age cohorts and custom age groups is another matter entirely. Analysts and researchers often need current estimates or projections for age-gender-race/origin groups that are not available from pre-planned tabulations. Uses of these SYOA data include the basics of understanding the size of a specific age group relative to the total population. Or, how the size of a total population age group compares among genders or a specific race/origin. There are a myriad of more focused applications such as estimating voter propensities/outcomes for certain combinations of age by gender by race/origin combinations. What single year of age data are available and how can they be used to meet these needs? SYOA Data Options The only Census Bureau-sourced option for SYOA county or sub-county geography data from Census 2010 forward is Census 2010. Age-related data from the American Community Survey (ACS) exist only for age groups (other than a few selected single year tabulations). Age-related data from the Census Bureau model-based annual estimates (county-up) are only available at the 5-year age cohort level. Most SYOA data (covering each age to age 99 and 100 and over) are further broken out only by gender and race/origin. That is, there are no SYOA summary data for other attributes such as foreign born for each/all ages. Census 2010 and ACS Public Use Microdata Sample data can be used to tabulate/estimate SYOA data with extended attributes though 1) such estimates can only be developed for areas 100,000 population or more and 2) the thinness of number of cases generally makes this infeasible. The National Center for Health Statistics (NCHS/NVSS) provides SYOA data for county geography. These data are controlled to Census Bureau annual model-based estimates (not released by Census). The NCHS "bridge estimates" data are available annually 2010 forward (2013 estimates available as of March 2015). See more information. ProximityOne provides census tract, ZIP code area and county-up geography SYOA estimates and projections to 2020. See more information about 5-year projections and projections to 2060. Census 2010 SYOA The Census-sourced single year of age demographics for sub-county areas are from the Census 2010 Summary File 1 (SF1). The Census 2010 SF1 "PCT012" (PCT: Population Census Tract and higher geography) tables provide single year of age by gender by race/origin population data for U.S. national scope census tract, ZIP code area and higher level geography. See more about the content and structure of the PCT012 tables. SYOA-based profiles based on the PCT012 data for ZIP Code area 77077 (Houston, TX) are shown below. The tables have been developed using the ProximityOne Modeler2 software (more below). Table 1. Single Year of Age by Race/Origin; 2010; ZIP Code Area: 77070 -- scroll section
2/ NHOPI: Native Hawaiian/Other Pacific Islander Source: ProximityOne -- http://proximityone.com/syoa.htm; based on Census 2010 Summary File 1 Table 2. Age by Race/Origin; Age Groups; 2010; ZIP Code Area: 77070
2/ NHOPI: Native Hawaiian/Other Pacific Islander Source: ProximityOne -- http://proximityone.com/syoa.htm; based on Census 2010 Summary File 1 Modeler2 Software The Modeler2 software has been developed by ProximityOne to create demographic-economic estimates and projections at the sub-county geographic levels including census tracts and ZIP code areas. Annual estimates and projections are developed for 2010 through 2020 by single year of age, and for age groups, by census tract and ZIP code area. The Modeler2 software can also be used to develop Census 2010-based SYOA profiles such as those shown above. While the Census 2010 PCT012 tables provide the basic data needed to develop these profiles, there is a lot that lies between the data existing and the development/availability of consumable data. As shown in the description of the PCT012 tables, the data are organized in Census 2010 SF1 as a set of tables that need to be separately accessed ... and then transformed to a usable format. The Modeler2 software provides two options to access and use the basic PCT012 data: via a locally stored all U.S. dataset or via the Census API (a feature integrated into the Modeler2 software). Members of the ProximityOne User Group can download and use Modeler2 Level 1 and create SYOA profiles for any county in the U.S. See the User Group section for more information about installation and use. Support Using these Resources Learn more about demographic economic data and related analytical tools. Join us in a Decision-Making Information Web session. There is no fee for these Web sessions. Each informal session is focused on a specific topic. The open structure also provides for Q&A and discussion of application issues of interest to participants. ProximityOne User Group Join the ProximityOne User Group to keep up-to-date with new developments relating to geographic-demographic-economic decision-making information resources. Receive updates and access to tools and resources available only to members. Use this form to join the User Group. There is no fee. Additional Information ProximityOne develops geographic-demographic-economic data and analytical tools and helps organizations knit together and use diverse data in a decision-making and analytical framework. We develop custom demographic/economic estimates and projections, develop geographic and geocoded address files, and assist with impact and geospatial analyses. Wide-ranging organizations use our software, data and methodologies to analyze their own data integrated with other data. Follow ProximityOne on Twitter at www.twitter.com/proximityone. Contact ProximityOne (888-364-7656) with questions about data covered in this section or to discuss custom estimates, projections or analyses for your areas of interest. |
|
|