|
|
ZIP Code Area 75205 Detailed Age-Race/Origin Profile
Decision-Making Information

|
ProximityOne
information resources & solutions
(888) DMI-SOLN
(888) 364-7656
Visual analysis with ProximityOne tools
click graphic for info; hover to pause
Decision-Making Information Blog
Power of Combining Maps with Data
Support & Technical Assistance
help using these resources
|
What are the population patterns by age/age group in census tract(s) or ZIP code area(s) of interest? How do these patterns vary by race/origin? What can these data tell you about variation/potential in business opportunities? What tracts or ZIP code areas might have underserved populations relative to your programs/goals? These types of questions can be answered by the types of data/data organization reviewed here.
Detailed age-race/origin demographics for ZIP Code area 75205 are provided in this section.
• Table 1 -- single year of age (SYOA) by race/origin
• Table 2 -- selected age cohorts by race/origin
Similarly structured profiles are also available for census tracts, counties and other geography. View profiles for other ZIP Code areas.
Tables shown below can be used to view the size of a specific age or age-group relative to the total population. There are a myriad of more focused applications such as estimating voter propensities/outcomes for certain combinations of age by gender by race/origin combinations.The tables have been developed using the ProximityOne Modeler2 software (more below).
ZIP Code Area 75205
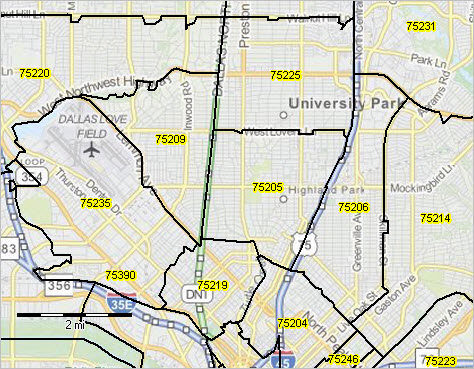
View developed with CV XE GIS.
ZIP Code 75205 is located in Dallas County, TX (48113).
More detailed demographic-economic data for all ZIP codes are available in these interactive tables: general demographics, social characteristics, economic characteristics and housing characteristics. See the this guide for more information about ZIP code data resources.
Data presented in the tables below are based on the Census-sourced single year of age demographics for sub-county areas from the
Census 2010 Summary File 1 (SF1).
The Census 2010 SF1 "PCT012" (PCT: Population Census Tract and higher geography) tables provide
single year of age by gender by race/origin population data for U.S. national scope census tract, ZIP code area and higher level geography.
See more about the content and structure of the PCT012 tables.
Data shown in the tables are also available structured as Excel files and with data presented as percentages in addition to population values.
The data are also available as datasets organized in alternative structures to facilitate other types of analysis (e.g., a set of ZIP Code areas with each record corresponding to one ZIP Code area).
The same scope of subject matter is available for current year estimates and projections to 2020.
Contact us (888.364.7656) for more information about these options.
ProximityOne uses these data to develop census tract, ZIP code area and county-up geography SYOA estimates and projections to 2020.
See more about 5-year projections.
Table 1. Single Year of Age by Race/Origin; 2010; Area: 75205 -- scroll section
| Age | Total | White
alone | Black
alone | AIAN /1
alone | Asian
alone | NHOPI /2
alone | Other race
alone | Two or
more races | Hispanic
any race |
| Total population | 23,061 | 21,178 | 326 | 64 | 770 | 3 | 362 | 358 | 1,385 |
| Age 0 | 180 | 163 | 3 | 0 | 6 | 0 | 4 | 4 | 13 |
| Age 1 | 174 | 154 | 2 | 2 | 4 | 0 | 4 | 8 | 17 |
| Age 2 | 208 | 190 | 2 | 0 | 7 | 0 | 3 | 6 | 17 |
| Age 3 | 207 | 193 | 3 | 0 | 2 | 0 | 2 | 7 | 14 |
| Age 4 | 245 | 218 | 1 | 2 | 11 | 0 | 7 | 6 | 18 |
| Age 5 | 263 | 240 | 1 | 1 | 15 | 0 | 0 | 6 | 15 |
| Age 6 | 290 | 257 | 1 | 0 | 15 | 0 | 8 | 9 | 26 |
| Age 7 | 328 | 290 | 1 | 1 | 19 | 0 | 6 | 11 | 24 |
| Age 8 | 328 | 299 | 4 | 1 | 14 | 0 | 2 | 8 | 15 |
| Age 9 | 276 | 257 | 1 | 0 | 11 | 0 | 2 | 5 | 18 |
| Age 10 | 344 | 323 | 1 | 3 | 8 | 0 | 2 | 7 | 23 |
| Age 11 | 337 | 316 | 0 | 0 | 11 | 0 | 3 | 7 | 13 |
| Age 12 | 332 | 306 | 3 | 1 | 13 | 0 | 2 | 7 | 18 |
| Age 13 | 341 | 312 | 3 | 0 | 8 | 0 | 6 | 12 | 25 |
| Age 14 | 362 | 329 | 3 | 0 | 12 | 0 | 7 | 11 | 27 |
| Age 15 | 306 | 283 | 3 | 2 | 9 | 0 | 1 | 8 | 14 |
| Age 16 | 349 | 311 | 3 | 2 | 16 | 0 | 9 | 8 | 24 |
| Age 17 | 295 | 271 | 2 | 4 | 8 | 0 | 6 | 4 | 22 |
| Age 18 | 632 | 547 | 23 | 3 | 28 | 0 | 15 | 16 | 50 |
| Age 19 | 1,242 | 1,084 | 54 | 3 | 51 | 0 | 13 | 37 | 103 |
| Age 20 | 881 | 799 | 26 | 0 | 24 | 0 | 20 | 12 | 61 |
| Age 21 | 580 | 516 | 23 | 0 | 16 | 0 | 10 | 15 | 37 |
| Age 22 | 481 | 432 | 19 | 2 | 13 | 0 | 9 | 6 | 30 |
| Age 23 | 336 | 314 | 3 | 1 | 4 | 0 | 5 | 9 | 28 |
| Age 24 | 288 | 255 | 7 | 1 | 9 | 0 | 10 | 6 | 29 |
| Age 25 | 278 | 243 | 3 | 0 | 14 | 0 | 11 | 7 | 22 |
| Age 26 | 257 | 232 | 2 | 0 | 11 | 0 | 6 | 6 | 20 |
| Age 27 | 276 | 239 | 5 | 1 | 16 | 0 | 12 | 3 | 26 |
| Age 28 | 244 | 214 | 5 | 1 | 13 | 0 | 7 | 4 | 32 |
| Age 29 | 238 | 207 | 2 | 4 | 13 | 0 | 7 | 5 | 21 |
| Age 30 | 232 | 204 | 5 | 2 | 7 | 0 | 11 | 3 | 28 |
| Age 31 | 188 | 162 | 3 | 2 | 9 | 0 | 7 | 5 | 20 |
| Age 32 | 214 | 189 | 7 | 1 | 7 | 1 | 5 | 4 | 21 |
| Age 33 | 217 | 190 | 7 | 0 | 10 | 0 | 5 | 5 | 25 |
| Age 34 | 194 | 166 | 3 | 1 | 14 | 0 | 8 | 2 | 17 |
| Age 35 | 224 | 196 | 5 | 0 | 20 | 0 | 2 | 1 | 10 |
| Age 36 | 244 | 217 | 3 | 1 | 17 | 0 | 4 | 2 | 21 |
| Age 37 | 237 | 204 | 3 | 1 | 19 | 0 | 7 | 3 | 24 |
| Age 38 | 242 | 217 | 3 | 0 | 13 | 0 | 5 | 4 | 17 |
| Age 39 | 299 | 267 | 3 | 1 | 17 | 0 | 10 | 1 | 28 |
| Age 40 | 349 | 321 | 3 | 1 | 8 | 1 | 9 | 6 | 27 |
| Age 41 | 335 | 302 | 3 | 1 | 23 | 0 | 6 | 0 | 20 |
| Age 42 | 282 | 247 | 3 | 0 | 22 | 0 | 6 | 4 | 17 |
| Age 43 | 373 | 334 | 4 | 0 | 18 | 0 | 12 | 5 | 24 |
| Age 44 | 299 | 269 | 3 | 2 | 17 | 0 | 5 | 3 | 18 |
| Age 45 | 345 | 325 | 0 | 0 | 9 | 0 | 2 | 9 | 23 |
| Age 46 | 330 | 289 | 5 | 2 | 27 | 0 | 5 | 2 | 22 |
| Age 47 | 365 | 340 | 7 | 0 | 12 | 0 | 5 | 1 | 22 |
| Age 48 | 329 | 315 | 4 | 2 | 7 | 0 | 0 | 1 | 16 |
| Age 49 | 369 | 356 | 1 | 0 | 8 | 0 | 2 | 2 | 7 |
| Age 50 | 344 | 333 | 2 | 1 | 2 | 0 | 3 | 3 | 11 |
| Age 51 | 326 | 299 | 3 | 2 | 10 | 0 | 6 | 6 | 19 |
| Age 52 | 358 | 341 | 6 | 0 | 7 | 0 | 1 | 3 | 12 |
| Age 53 | 337 | 314 | 3 | 1 | 9 | 0 | 8 | 2 | 22 |
| Age 54 | 326 | 314 | 2 | 0 | 3 | 1 | 5 | 1 | 12 |
| Age 55 | 298 | 283 | 3 | 2 | 7 | 0 | 2 | 1 | 7 |
| Age 56 | 280 | 273 | 1 | 1 | 4 | 0 | 0 | 1 | 8 |
| Age 57 | 282 | 269 | 4 | 0 | 4 | 0 | 3 | 2 | 10 |
| Age 58 | 262 | 251 | 4 | 0 | 4 | 0 | 0 | 3 | 8 |
| Age 59 | 263 | 250 | 2 | 1 | 5 | 0 | 3 | 2 | 7 |
| Age 60 | 273 | 264 | 2 | 0 | 3 | 0 | 2 | 2 | 6 |
| Age 61 | 244 | 237 | 1 | 0 | 6 | 0 | 0 | 0 | 2 |
| Age 62 | 218 | 213 | 1 | 0 | 2 | 0 | 0 | 2 | 1 |
| Age 63 | 208 | 201 | 2 | 1 | 1 | 0 | 2 | 1 | 5 |
| Age 64 | 190 | 187 | 1 | 0 | 1 | 0 | 1 | 0 | 3 |
| Age 65 | 157 | 157 | 0 | 0 | 0 | 0 | 0 | 0 | 5 |
| Age 66 | 150 | 144 | 2 | 1 | 3 | 0 | 0 | 0 | 3 |
| Age 67 | 154 | 152 | 0 | 0 | 1 | 0 | 0 | 1 | 0 |
| Age 68 | 140 | 136 | 0 | 0 | 0 | 0 | 2 | 2 | 1 |
| Age 69 | 107 | 104 | 0 | 0 | 3 | 0 | 0 | 0 | 1 |
| Age 70 | 116 | 110 | 0 | 1 | 2 | 0 | 2 | 1 | 4 |
| Age 71 | 110 | 110 | 0 | 0 | 0 | 0 | 0 | 0 | 1 |
| Age 72 | 106 | 104 | 0 | 0 | 1 | 0 | 1 | 0 | 4 |
| Age 73 | 88 | 86 | 0 | 0 | 2 | 0 | 0 | 0 | 1 |
| Age 74 | 108 | 107 | 0 | 0 | 0 | 0 | 0 | 1 | 4 |
| Age 75 | 107 | 105 | 0 | 0 | 1 | 0 | 1 | 0 | 6 |
| Age 76 | 79 | 78 | 0 | 0 | 0 | 0 | 1 | 0 | 2 |
| Age 77 | 93 | 91 | 1 | 0 | 0 | 0 | 1 | 0 | 0 |
| Age 78 | 81 | 80 | 0 | 0 | 0 | 0 | 0 | 1 | 0 |
| Age 79 | 79 | 78 | 0 | 0 | 1 | 0 | 0 | 0 | 0 |
| Age 80 | 72 | 70 | 0 | 1 | 1 | 0 | 0 | 0 | 1 |
| Age 81 | 56 | 56 | 0 | 0 | 0 | 0 | 0 | 0 | 0 |
| Age 82 | 48 | 48 | 0 | 0 | 0 | 0 | 0 | 0 | 1 |
| Age 83 | 56 | 56 | 0 | 0 | 0 | 0 | 0 | 0 | 1 |
| Age 84 | 68 | 66 | 0 | 0 | 1 | 0 | 1 | 0 | 1 |
| Age 85 | 48 | 47 | 1 | 0 | 0 | 0 | 0 | 0 | 1 |
| Age 86 | 37 | 37 | 0 | 0 | 0 | 0 | 0 | 0 | 0 |
| Age 87 | 29 | 28 | 1 | 0 | 0 | 0 | 0 | 0 | 2 |
| Age 88 | 36 | 35 | 0 | 0 | 1 | 0 | 0 | 0 | 0 |
| Age 89 | 29 | 29 | 0 | 0 | 0 | 0 | 0 | 0 | 0 |
| Age 90 | 37 | 36 | 0 | 0 | 0 | 0 | 1 | 0 | 1 |
| Age 91 | 12 | 12 | 0 | 0 | 0 | 0 | 0 | 0 | 1 |
| Age 92 | 24 | 24 | 0 | 0 | 0 | 0 | 0 | 0 | 0 |
| Age 93 | 14 | 13 | 0 | 0 | 0 | 0 | 1 | 0 | 1 |
| Age 94 | 10 | 10 | 0 | 0 | 0 | 0 | 0 | 0 | 0 |
| Age 95 | 7 | 7 | 0 | 0 | 0 | 0 | 0 | 0 | 0 |
| Age 96 | 6 | 6 | 0 | 0 | 0 | 0 | 0 | 0 | 0 |
| Age 97 | 8 | 8 | 0 | 0 | 0 | 0 | 0 | 0 | 0 |
| Age 98 | 5 | 5 | 0 | 0 | 0 | 0 | 0 | 0 | 0 |
| Age 99 | 5 | 5 | 0 | 0 | 0 | 0 | 0 | 0 | 0 |
| Age 100-104 | 4 | 4 | 0 | 0 | 0 | 0 | 0 | 0 | 1 |
| Age 105-110 | 1 | 1 | 0 | 0 | 0 | 0 | 0 | 0 | 0 |
| Age 110 up | 0 | 0 | 0 | 0 | 0 | 0 | 0 | 0 | 0 |
1/ AIAN: American Indian/Alaska Native
2/ NHOPI: Native Hawaiian/Other Pacific Islander
Table 2. Age by Race/Origin; Age Groups; 2010; Area: 75205
| Age | Total | White
alone | Black
alone | AIAN /1
alone | Asian
alone | NHOPI /2
alone | Other race
alone | Two or
more races | Hispanic
any race |
| Total population | 23,061 | 21,178 | 326 | 64 | 770 | 3 | 362 | 358 | 1,385 |
| Age 0-4 | 562 | 507 | 7 | 2 | 17 | 0 | 11 | 18 | 47 |
| Age 5-9 | 1,333 | 1,198 | 7 | 4 | 62 | 0 | 23 | 39 | 97 |
| Age 10-14 | 1,617 | 1,501 | 9 | 5 | 57 | 0 | 11 | 34 | 87 |
| Age 15-19 | 1,653 | 1,506 | 14 | 8 | 53 | 0 | 29 | 43 | 112 |
| Age 20-24 | 3,816 | 3,378 | 145 | 8 | 132 | 0 | 67 | 86 | 281 |
| Age 25-29 | 1,435 | 1,283 | 20 | 3 | 54 | 0 | 44 | 31 | 125 |
| Age 30-34 | 1,116 | 976 | 22 | 10 | 49 | 1 | 37 | 21 | 122 |
| Age 35-39 | 1,116 | 973 | 21 | 3 | 80 | 0 | 26 | 13 | 97 |
| Age 40-44 | 1,507 | 1,354 | 15 | 3 | 83 | 1 | 36 | 15 | 109 |
| Age 45-49 | 1,712 | 1,557 | 19 | 4 | 83 | 0 | 29 | 20 | 109 |
| Age 50-54 | 1,726 | 1,644 | 16 | 5 | 34 | 0 | 12 | 15 | 65 |
| Age 55-59 | 1,523 | 1,453 | 13 | 4 | 27 | 1 | 18 | 7 | 59 |
| Age 60-64 | 1,260 | 1,215 | 10 | 1 | 20 | 0 | 5 | 9 | 24 |
| Age 65-69 | 859 | 841 | 5 | 2 | 6 | 0 | 3 | 2 | 16 |
| Age 70-74 | 579 | 564 | 0 | 1 | 6 | 0 | 5 | 3 | 11 |
| Age 75-79 | 475 | 467 | 1 | 0 | 3 | 0 | 3 | 1 | 13 |
| Age 80-84 | 336 | 332 | 0 | 1 | 2 | 0 | 0 | 1 | 2 |
| Age 85 up | 436 | 429 | 2 | 0 | 2 | 0 | 3 | 0 | 9 |
1/ AIAN: American Indian/Alaska Native
2/ NHOPI: Native Hawaiian/Other Pacific Islander
Modeler2 Software
These tables have been developed using the ProximityOne Modeler2 software.
Modeler2 is also used to create demographic-economic estimates and projections at the
sub-county geographic levels including census tracts and ZIP code areas.
Annual estimates and projections are developed for 2010 through 2020 by single year of age,
and for age groups, by census tract and ZIP code area.
Support Using these Resources
Learn more about demographic economic data and related analytical tools.
Join us in a Data Analytics Web session.
There is no fee for these Web sessions.
Each informal session is focused on a specific topic.
The open structure also provides for Q&A and discussion of application issues of interest to participants.
ProximityOne User Group
Join the ProximityOne User Group
to keep up-to-date with new developments relating to geographic-demographic-economic decision-making information resources.
Receive updates and access to tools and resources available only to members.
Use this form to join the User Group.
There is no fee.
Additional Information
ProximityOne develops geographic-demographic-economic data and analytical tools and helps organizations knit together and use diverse data in a decision-making and analytical framework. We develop custom demographic/economic estimates and projections, develop geographic and geocoded address files, and assist with impact and geospatial analyses.
Wide-ranging organizations use our software, data and methodologies to analyze their own data integrated with other data.
Follow ProximityOne on Twitter at
www.twitter.com/proximityone.
Contact ProximityOne (888-364-7656) with questions about data covered in this section or to discuss custom estimates, projections or analyses for your areas of interest.
|
