|
|
|
2013 State Legislative Districts -- examining urban/rural population characteristics and patterns
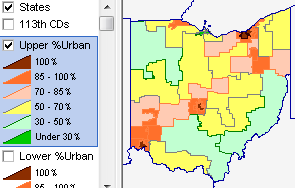
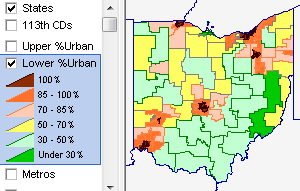
As of 2013, the 6,558 state legislative districts in the U.S. are comprised of 4,629 lower/house chambers and 1,929 upper/senate chambers. Of the total state legislative districts, 1,257 are 100-percent urban (every census block comprising the district is urban), 19 are 100-percent rural, and 927 are less than 1-percent urban. Use the interactive table in this section to view, rank, compare state legislative districts by rural and urban population and geographic area. Use GIS tools to visually examine U.S. or state by state legislative district patterns such as percent population urban. Ohio State Legislative Districts by Percent Urban Population
Use the GIS resources described below to create/view state legislative district reference maps (any/all states, zoom to one district). State Legislative Districts State legislative districts are the areas from which members are elected to state or equivalent entity legislatures. State legislative districts are comprised of upper (senate) and lower (house) chambers. Nebraska has a unicameral legislature and the District of Columbia has a single council; these are treated as upper-chamber legislative areas in the interactive table. 2013 State Legislative Districts -- Urban/Rural Characteristics -- interactive table There is one row for each state legislative district. Click column header to sort; click again to sort other direction. See related Ranking Tables Main Page Table Notes and Usage Operations: • Click ShowAll button between queries. • To view the list of all Lower districts (summary level L): - click ShowAll button. - optionally select a state (left dropdown below table). - click District Type selector below table and choose L; table refreshes. State Legislative Districts (SLD) GIS Project -- Reference & Pattern Mapping/Analysis • Use the U.S. national scope State Legislative District GIS Project on your computer. • Create reference or thematic pattern maps; integrate your data. • ProximityOne User Group (join now, no fee) members may download/use at no fee. Installation & Usage Details • Unzip the State Legislative District project using the link provided in the User Group section to folder c:\sld\. • Start the CV XE GIS software (any version works). • With CV XE running, use File>Dialog to open the GIS project c:\sld\sld1.gis. The start-up view appears: 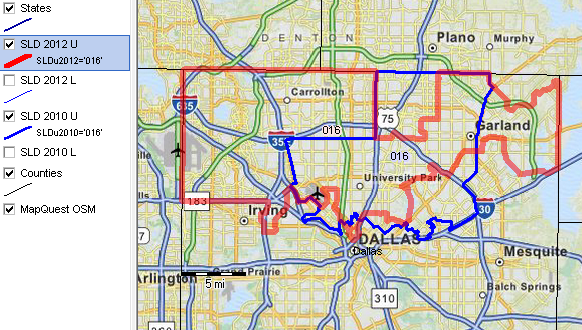 The above start-up view shows a zoom-in to the Dallas, Texas area. A query has been places on the SLDU 2012 and SLDU 2010 layers to show/compare Texas senate district 016 in 2010 and 2012 vintages. See more about SLD vintages and related issues. The GIS project includes shapefiles (shown in legend panel in above view) listed below. SLD shapefiles do not include subject matter; SLD shapefile fields include state code and SLD code. - SLD 2012 U -- U.S. national scope SLD shapefile; 2012 (2012 election cycle) -- upper chamber - SLD 2012 L -- U.S. national scope SLD shapefile; 2012 (2012 election cycle) -- lower chamber - SLD 2010 U -- U.S. national scope SLD shapefile; 2010 (Census 2010) -- upper chamber - SLD 2010 L -- U.S. national scope SLD shapefile; 2010 (Census 2010) -- lower chamber - Counties -- U.S. national scope counties - U.S. by state Support Using these Resources Join us in a Data Analytics Lab session. There is no fee for these one-hour Web sessions. Each informal session is focused on a specific topic. The open structure also provides for Q&A and discussion of application issues of interest to participants. ProximityOne User Group Join the ProximityOne User Group to keep up-to-date with new developments relating to geographic-demographic-economic decision-making information resources. Receive updates and access to tools and resources available only to members. Use this form to join the User Group. Additional Information ProximityOne develops geographic-demographic-economic data and analytical tools and helps organizations knit together and use diverse data in a decision-making and analytical framework. We develop custom demographic/economic estimates and projections, develop geographic and geocoded address files, and assist with impact and geospatial analyses. Wide-ranging organizations use our tools (software, data, methodologies) to analyze their own data integrated with other data. Follow ProximityOne on Twitter at www.twitter.com/proximityone. Contact ProximityOne (888-364-7656) with questions about data covered in this section or to discuss custom estimates, projections or analyses for your areas of interest. |
|
|