
|
|
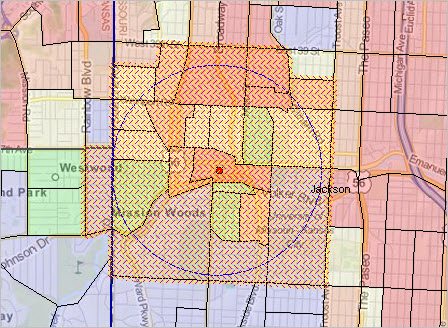
What is the population in households, income or housing value with in a 5-mile radius of a location of interest? 10 miles? How do these areas compare? Get answers using the ProximityOne SiteReport tool or custom reports prepared for you. "Site reports" are demographic-economic reports developed for an area for a specified radius around a specific location (latitude-longitude). Business people, researchers, analysts and others need to be able to understand characteristics of one service or market area and how it compares to others; for example the number of households (by characteristics - like those with solar power) within a 5-mile radius compared to the number of households (by characteristics -- like the number in a selected income range) within a 10-mile radius. Illustrative Application - 1-mile radius site about red marker point/location - block groups shown with black boundaries - shows thematic map pattern of economic prosperity (median household income)  Map view developed using ProximityOne CV XE GIS software. Starbucks location at 302 Nichols Rd. Kansas City, MO 64112 (latitude 39.041552 and longitude -94.592965) See view without thematic map layer Market-Study Area Comparative Analysis Report Examples - click link to view an example. SiteReport can be used to create comparative analysis circular area profiles to meet wide-ranging application needs. Some examples are listed below. Get your first report free. Enter the site address (or lat-lon) and radius in the text section using this form. • Starbucks, 302 Nichols Rd, Kansas City, MO - 1mi-3mi • Two Georges, Boca Raton, FL - 3mi-5mi - restaurant • Space Center Houston, TX - 5mi-10mi • Somerset, NH - 10mi-20mi - health care facility • Diablo Canyon Nuclear Facility, Avila Beach, CA - 25mi-50mi - larger area - impact analysis • 1 Infinite Loop, Cupertino, CA 95014 - 1mi-5mi - Apple Computer • 133 E 64th St., New York, NY - 0.35mi-0.55mi - smaller area - real estate - neighborhood Get Reports using our Service or Software • Service -- have ProximityOne provide you with ready-to-use reports. -- contact us or call 888.364.7656 to order a report. if using the form, enter "SiteReport" in text/message section and we will contact you. -- bulk processing services are available to generate site summaries in database structure. • Software (runs on Windows computers; Internet required) -- use the software on your computer to create an unlimited number of reports. -- contact us or call 888.364.7656 for ordering information. How the Report it Developed The underlying software algorithm determines every census tract or block group intersecting the circle. Composite area aggregated and distributional (e.g., medians, averages, etc.) data are computed and displayed in the report. Market-Study Area Comparative Analysis Report Content The standard comparative analysis report compare two sites side-by-side and their difference. The report includes several hundred demographic-economic items organized into 4 major subject matter areas List of Tables/Subject Matter (scroll section)
General Demographics
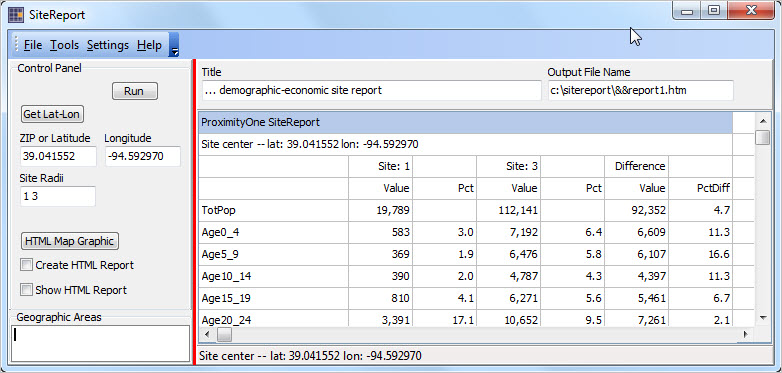
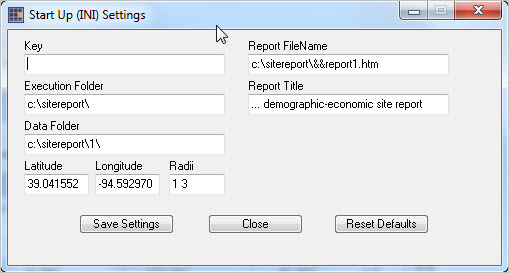
- Age - Age and Gender - Race - Hispanic or Latino (any race) Economic Characteristics - Household Income and Benefits - Family Income and Benefits - Other Income Measures - Poverty Status Over the Last 12 Months - Employment Status - Children with all Parents Working - Commuting to Work - Workers by Occupation - Workers by Industry - Class of Worker - Insurance Coverage Social Characteristics - Households by Type - Persons by Household Type / Group Quarters - Relationship - Marital Status - Fertility - Grandparents as Caregivers - School Enrollment - Educational Attainment - Veteran Status - Disabled by Age - Residence 1 Year Ago - Place of Birth and Citizenship Status - Year of Entry - World Region of Birth of Foreign Born - Language Spoken at Home Housing Characteristics - Housing Occupancy and Tenure - Units In Structure - Year Structure Built - Year Householder Moved Into Unit - Vehicles Available - House Heating Fuel - Selected Characteristics - Occupants per Room - Home Values - Selected Monthly Owner Costs - Gross Rent SiteReport Software Start-up View The start-up view of the SiteReport software is shown in the graphic below. The site report is for a 1-mile and 3-mile radius from the Starbucks location at 301 Nichols Road, Kansas City, MO 64112 (39.041552, -94.592970). The grid structure provides an analytical view of the two circular areas (Site 1 and Site 2) and comparison. It may be saved to an excel file. The population in site 2 is 112,141 compared to site 1 population of 19,789. The difference, 92,352, shows that Site 2 has a population that is 4.7 times the size of Site1. It is easy to compare characteristics of each site based on many measures and also see how they relate on each demographic-economic attribute.  SiteReport Software Operation Start SiteReport from the desktop icon. The SiteReport start-up view (see above) is organized as: • toolbar at the top of the Window • control panel at left • grid section at right • title section above the grid section Operations • Click the "Run" button to create a report. .. the report is generated based on the settings in the control and title panels. .. when SiteReport starts, it populates the settings values based on the Start-up Settings (see below). .. the minimum required inputs are a valid 5-digit ZIP code and radius (integer, specifying miles) .. the Run button may be clicked/used to run different report, repeatedly, with different settings. .. each time the Run button is clicked, the grid refreshes with the new report. .. any previous report is overwritten unless it is saved. • Enter radius in the "Radii" edit box. .. a minimum of one radius value is required. .. multiple radius values may be used; separate multiple radii with a space. .. each radius entered may be fractional and is in units of miles. .. the suggested minimum size radius is 0.3 miles. • Creating/Saving a report. .. Use the File>SaveAs operation to save a profile in grid/analytical format (xls). .. HTML formatted reports are generated only if "Create HTML Report" is checked. ... if the "Show HTML Report" is checked, the report will be automatically opened. ... the HTML report file will be saved to the file path and name as shown in the "Output File Name" above grid. ... to use a site graphic click the "HTML Map Graphic" button to select the map graphic from local computer. ... the HTML map graphic should be created using steps described here. • A location C9site center) can be specified as a ZIP code or latitude-longitude .. when using the ZIP code, the "Longitude" edit box should be null, no value. .. when using lat-lon, enter the latitude in the "ZIP/Latitude" edit box and ... and the longitude (with lead minus) in the "Longitude" edit box • Get the latitude-longitude for an address, or determine it visually, using the "Get Lat-Lon" button. .. get latitude-longitude from your own data or use the "Get Lat-Lon" button. .. when the interactive map form displays, enter an address to find the lat-lon, or ... slide the map to visually see/select the lat-lon. .. the lat-lon of the present cursor position is shown in the lower right of the map form. • The "Geographic Areas" listbox is used to batch run a set of "site profiles". .. a site profile is the ZIP or lat-lon and associated radius. .. not active this version. Start-up Settings When SiteReport starts, it populates the settings values based on the Start-up Settings. The start-up settings may be modified using the Tools>Start-up Settings. The default settings are shown in the following graphic.  Terms of Use The reports and data may be used in any manner. We request that the source of the data acknowledge ProximityOne and include a reference to the ProximityOne web site -- http://proximityone.com. The software is licensed to the original licensee. It may not be shared. Best efforts have been made in the development of the software, data and reports. There is no warranty with respect to any aspect of the software, data or reports. The user is solely responsible for any use made of the software, data or reports. ProximityOne User Group Join the ProximityOne User Group to keep up-to-date with new developments relating to metros and component geography decision-making information resources. Receive updates and access to tools and resources available only to members. Use this form to join the User Group. Support Using these Resources Learn more about accessing and using demographic-economic data and related analytical tools. Join us in a Data Analytics Lab session. There is no fee for these one-hour Web sessions. Each informal session is focused on a specific topic. The open structure also provides for Q&A and discussion of application issues of interest to participants. Additional Information SiteReport has been developed by ProximityOne. ProximityOne collaborates with the University of Missouri to operate a Data Analytics Lab. Some parts of SiteReport use underlying data developed by the University and the Census Bureau. Contact us for information about operating a Data Analytics Lab. ProximityOne develops geodemographic-economic data and analytical tools and helps organizations knit together and use diverse data in a decision-making and analytical framework. We develop custom demographic/economic estimates and projections, develop geographic and geocoded address files, and assist with impact and geospatial analyses. Wide-ranging organizations use our tools (software, data, methodologies) to analyze their own data integrated with other data. Follow ProximityOne on Twitter at www.twitter.com/proximityone. Contact us (888-364-7656) with questions about data covered in this section or to discuss custom estimates, projections or analyses for your areas of interest. |
|
|