
|
|
|
Analyzing Business Patterns -- ZIP Code & County Patterns by Detailed Type of Business
Consider that you are engaged in a business that provides certain financial services in a metro. What is your competitive position -- how many other establishments offer a similar service in your market area? How do you best define your market area -- what geographies in your area have the largest number of prospects or are otherwise most appealing? What are the sales potential in this market area -- what are the best measures to examine sale potential? How can answers to these questions help you make decisions about the what, where and how to expand your business and improve profitability? How can your historical sales data be used to help identify geographic areas of opportunity? Tools and methods described here can help answer these questions and facilitate strategic planning. This section provides illustrative data analytics views and application examples using a combination of demographic-economic data, business patterns data and related data with Geographic Information System (GIS) tools. The applications use the ProximityOne CV XE GIS software. Applications make use of U.S. national scope 1) ZIP code demographic-economic data and 2) county and ZIP code business patterns data for 2012 and 2013. Using Financial Services Businesses as an Example Part of the Financial Services sector (Financial Activities NAICS code 5239) is used in applications reviewed here. However, the tools, data and methodologies apply to hundreds of other types of business. See about NAICS -- a type of business code. The annually updated county business patterns dataset includes 2.1 million records -- data for each of the 3,143 counties iterated by type of business. For example, Fulton County, GA (red fill pattern in map below) has approximately 1,700 types of business data records. The ZIP code dataset detail dataset includes 3.2 million records -- data for each of more than 38,800 ZIP codes. Each data record provides data on the number of establishments, payroll, employment and related data. 17,615 ZIP codes have a summary record for the Financial Activities NAICS 5239 industry. ProximityOne uses these data to examine county and sub-county economic patterns as a part of the Situation & Outlook demographic-economic-business estimates and projections See more about the business patterns data. Financial Activities NAICS Code 5239 Patterns -- Atlanta Region by County The following map graphic shows patterns of the number of business establishments (businesses engaged in Financial Activities NAICS code 5239) by county. The Atlanta metro is shown with bold brown boundary. The legend at the left of the map shows number of establishments by county and corresponding color. The identify tool is used to click on Fulton County (red fill pattern) and display a profile. The content of the profile is shown in the table presented below. 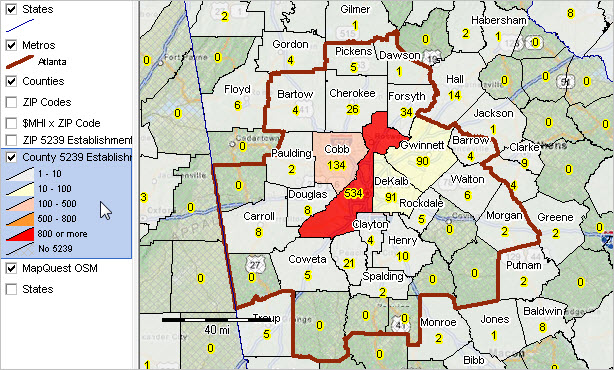 -- view created using CV XE GIS and associated Business Patterns GIS Project -- click graphic for larger showing details. Number of Total Establishments by ZIP Code -- Atlanta Metro Zoom-in The following map graphic shows patterns of the number of business establishments by ZIP code in the Atlanta metro area. ZIP code area color patterns show businesses engaged in NAICS 5239. Areas with no color (base map is visible) have no businesses in NAICS 5239. 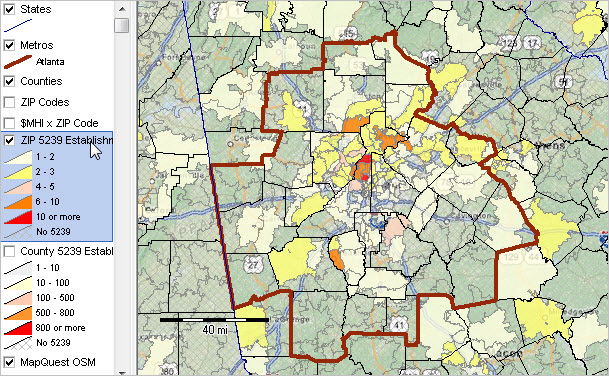 -- click graphic for larger showing details. Related view -- Above view Zoom-in ZIP code areas are labeled with ZIP code and with number of establishments (below ZIP code). $Median Household Income by ZIP Code -- Atlanta Metro Zoom-in The following map graphic shows patterns of median household income ($MHI) by ZIP code in the Atlanta metro area. ZIP code area color patterns show the level of $MHI. $MHI is used here as an illustration/proxy market strength by ZIP for investment advisory services. In an actual application, a related but different measure would need to be used showing number of prospects as well as income level.  -- click graphic for larger showing details. Related view -- Above view Zoom-in ZIP code areas are labeled with ZIP code and with $MHI (below ZIP code). Financial Investment Activities (NAICS Code 5239) This industry group comprises establishments primarily engaged in one of the following: • acting as principals in buying or selling financial contracts (except investment bankers, securities dealers, and commodity contracts dealers); • acting as agents (i.e., brokers) (except securities brokerages and commodity contracts brokerages) in buying or selling financial contracts; • providing other investment services (except securities and commodity exchanges), such as portfolio management; investment advice; and trust, fiduciary, and custody services. Business Pattern Profile for Fulton County, GA -- NAICS Code 5239 Financial Investment Activities
Who Are these Businesses? The following list shows businesses in a few New York counties/cities.
About NAICS NAICS (North American Industry Classification System) is the standard used by Federal statistical agencies in classifying business establishments for the purpose of collecting, analyzing and publishing statistical data related to the U.S. business economy. NAICS codes are 6-character codes used as shorthand for industry categories/types of bsuiness. See list of NAICS codes. More about the Data Applications reviewed here blend two different types of data. The Business Patterns data provide data on the characteristics of businesses (providers of services in these applications); the universe of tabulation is businesses. The demographic-economic data provide data on the characteristics of the population and households (consumers of business services in the applications); the universe of tabulation is population and households. Demographic-Economic Data. The demographic-economic data is derived from the American Community Survey 2013 5-year estimates. See more about these data at ACS2013 5-year estimates. View these data in interactive tables at ZIP Code Demographics. Business Patterns Data. The business patterns basic data items are extracted from the Business Register (BR), a database of all known single and multi-establishment employer companies maintained and updated by the Census Bureau. The BR contains the most complete, current, and consistent data for business establishments. The annual Company Organization Survey provides individual establishment data for multi-establishment companies. Data for single-establishment companies are obtained from various programs, such as the Economic Census, Annual Survey of Manufactures and Current Business Surveys, as well as from administrative record sources. The data are updated annually. There is an approximate lag of 18 months between the data reference period and the data access date. An establishment is a single physical location at which business is conducted or services or industrial operations are performed. An establishment is not necessarily equivalent to a company or enterprise, which may consist of one or more establishments. A single-unit company owns or operates only one establishment. A multi-unit company owns or operates two or more establishments. The treatment of establishments on the Business Register differs according to whether the establishment is part of a single-unit or multi-unit company. Coverage excludes data on self-employed individuals, employees of private households, railroad employees, agricultural production employees and most government employees. County and ZIP Code area business pattern data are updated annually. 2013 business pattern data became available in April 2015; data for 2014 business patterns will be available in April 2016. Data Resources Relating to NAICS 5239 Support Using these Resources Learn more about demographic economic data and related analytical tools. Join us in a Data Analytics Web session. There is no fee for these Web sessions. Each informal session is focused on a specific topic. The open structure also provides for Q&A and discussion of application issues of interest to participants. ProximityOne User Group Join the ProximityOne User Group to keep up-to-date with new developments relating to geographic-demographic-economic decision-making information resources. Receive updates and access to tools and resources available only to members. Use this form to join the User Group. There is no fee. Additional Information ProximityOne develops geographic-demographic-economic data and analytical tools and helps organizations knit together and use diverse data in a decision-making and analytical framework. We develop custom demographic/economic estimates and projections, develop geographic and geocoded address files, and assist with impact and geospatial analyses. Wide-ranging organizations use our software, data and methodologies to analyze their own data integrated with other data. Follow ProximityOne on Twitter at www.twitter.com/proximityone. Contact ProximityOne (888-364-7656) with questions about data covered in this section or to discuss custom estimates, projections or analyses for your areas of interest. | ||||||||||||||||||||||||||||||||||||||||||||||||||||||||||||||||||||||||||||||||||||||||||||||||||||||||||||||||||||||||||||||||||||||||||||||||||||||||||||||||||||||||||||||||||||||||||||||||||||||||||||||||||||||||||||||||||||||||||||||||||||||||||||||||||||||||||||||||||||||||||||||||||||||||||||||||||||||||||||||||||||||||||||||||||||||||||||||||||||||||||||||||||||||||||||||||||||||||||||||||||||||||||||||||||||||||||||||||||||||||||||||||||||||
|
|