
|
|
|
This section provides a guide to accessing, integrating and using selected local area labor force characteristics for wide-ranging analysis and decision-making applications. A "local area" as used here refers mainly to city/place, county and sub-county geography (census tract and ZIP Code area). This section is focused on: 1) updates to the Bureau of Labor Statistics Local Area Unemployment Statistics program and how this affects labor force data availability and use and (access new data from this program; see Local Area Employment Situation) 2) an interactive table providing access to ZIP Code area labor force characteristics based on the American Community Survey 2016 5-year data. Overview Statistical programs that provide local area labor force/employment data include: • American Community Survey (block group, ZIP Code area, city/place, census tract up) • ProximityOne current estimates and projections (census tract up) • Census Bureau ZIP Code/County Business Patterns • BLS Local Area Unemployment Statistics (city/place and county up) -- below • BLS Quarterly Census of Employment and Wages (county up) • BEA Regional Economic Information System (county up) • Decennial census (Census 2000 and earlier) Advantages/disadvantages, strengths/weaknesses and more about accessing, integrating and using these data will be included in the mid-March update. Employment Situation by ZIP Code Area The following graphic shows the percent unemployed by ZIP Code area in the Houston, Texas/Harris County (bold black boundary) area. The ACS 2013 5-year estimates of the unemployment rate, included in the interactive table below, are shown as a thematic map. It is easy to see which areas/ZIP codes are experiencing higher/lower unemployment rates. 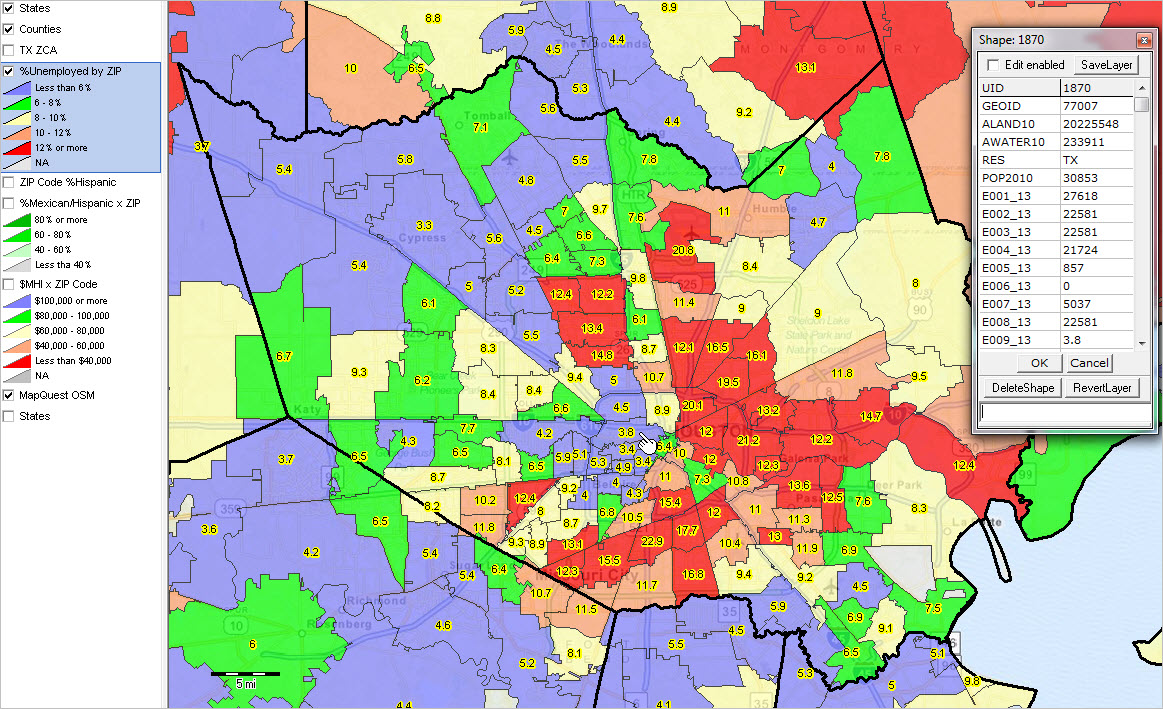 Click for larger view; larger view shows mini-profile of ZIP Code 77077. See more ZIP Code demographic-economic data resources. View created using CV XE GIS. Use the interactive table in this section to view, rank, compare, query selected labor force characteristics by ZIP code area based on the ACS 2016 5 year estimates. ACS 2016 Labor Force Characteristics by ZIP Code Area -- Interactive Table Click ShowAll button between queries. Click column header to sort; click again to sort other direction. Data based on ACS 2016 5 year estimates. See usage notes below table. See related Interactive Tables Main Page Table Notes and Usage Columns - Use mouseover on column header cell to view description of column. - Drag header column dividers to modify column width. Operations • Click ShowAll button between queries. • Click on a column header to sort ascending/descending on that column. • Use State dropdown box below table to select/filter on a state. • Use Find ZIP Code to view characteristics of one ZIP Code. - Click ShowAll button first. - Key in 5-digit ZIP Code and click Find ZIP Code button. - Search will filter for any name with that exact, case sensitive, spelling. - ZIP Code 77007 is used as an example (also used for data display shown below and in map view). Codes & Additional Details • View list of state-county codes (col 3) • View list of CBSA/Metro codes (col 3) Support Using these Resources Learn more about demographic economic data and related analytical tools. Join us in a Decision-Making Information Web session. There is no fee for these Web sessions. Each informal session is focused on a specific topic. The open structure also provides for Q&A and discussion of application issues of interest to participants. ProximityOne User Group Join the ProximityOne User Group to keep up-to-date with new developments relating to geographic-demographic-economic decision-making information resources. Receive updates and access to tools and resources available only to members. Use this form to join the User Group. There is no fee. Additional Information ProximityOne develops geographic-demographic-economic data and analytical tools and helps organizations knit together and use diverse data in a decision-making and analytical framework. We develop custom demographic/economic estimates and projections, develop geographic and geocoded address files, and assist with impact and geospatial analyses. Wide-ranging organizations use our software, data and methodologies to analyze their own data integrated with other data. Follow ProximityOne on Twitter at www.twitter.com/proximityone. Contact ProximityOne (888-364-7656) with questions about data covered in this section or to discuss custom estimates, projections or analyses for your areas of interest. |
|
|