
|
|
|
-- topics summary 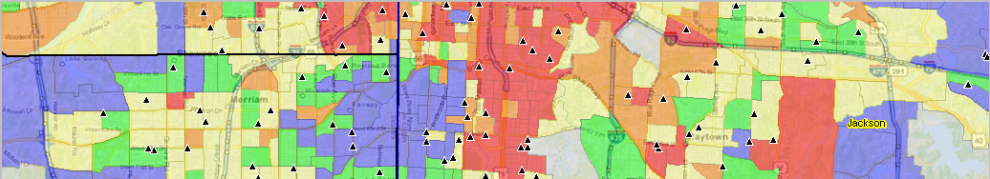
The Data Analytics blog covers topics related to decision-making information resources and solutions. It is focused on the development, integration and use of geographic-demographic-economic data to help stakeholders better understand where we are now; the what, when and where things will change in the future; and how change might impact us. The graphic shown above provides a visual example of topics covered in the blog, though focused mainly on the "now" dimension. This is a view developed by GIS software showing a thematic pattern of median household income by Census 2010 block group using American Community Survey (ACS) data. Subject matter data from ACS have been integrated into the block group shapefile (TIGER/Line) . The view is located in the Kansas City metro but could be anywhere in the world. More about this blog ... scroll section ...
The thematic pattern of median household income by block group is shown as a layer superimposed on a MapQuest OpenStreetMap layer used as a base layer. Schools are shown as triangular markers. Other wide-ranging geography and subject matter could be added to the view. Merging diverse independent entities into a holstic picture for collaboration and decision-making.
The timeline "model" for this blog follows new developments in selected major geographic and demographic-economic statistical programs. New data from these programs create new opportunities to examine new/updated characteristics and change. Timeline topics are also driven by current events relating to these areas and developments. The blog theme is also driven by type of geography: the world, U.S. and states; metros and component areas; and counties, cities/places, schools & school districts, census tracts, block groups, census blocks, road segments and point locations. The blog is written by Warren Glimpse (send message): • econometrician & modeler; former Census Bureau statistician • founder and principal of ProximityOne • developer S&O demographic-economic estimates & projections • developer Census Bureau State Data Center Program • developer prototype Census Bureau TIGER/Line GBF • developer CV XE GIS & wide-ranging integrated systems Join the ProximityOne User Group • exclusively for members: software, data access and application support privileges • selected datasets corresponding to interactive tables, and others, available for download • view benefits & register: http://proximityone.com/usergroup.htm Data Analytics Blog Topics -- scroll section • Click date link to view blog topic; click Corresponding-WebPage link to view as HTML page. • See usage notes below table. Usage notes: • Search for keyword: - click ShowAll button - type search term in edit box below table (where "Projection" now shown -- no quotes) - click Find> button; search then made in Topic column for search term entered (case sensitive) - example: Metros: will locate all metro integrated data profiles Support Using these Resources Learn more about accessing and using demographic-economic data and related analytical tools. Join us in a Data Analytics Lab session. There is no fee for these one-hour Web sessions. Each informal session is focused on a specific topic. The open structure also provides for Q&A and discussion of application issues of interest to participants. ProximityOne User Group Join the ProximityOne User Group to keep up-to-date with new developments relating to geographic-demographic-economic decision-making information resources. Receive updates and access to tools and resources available only to members. Use this form to join the User Group. Additional Information ProximityOne develops geographic-demographic-economic data and analytical tools and helps organizations knit together and use diverse data in a decision-making and analytical framework. We develop custom demographic/economic estimates and projections, develop geographic and geocoded address files, and assist with impact and geospatial analyses. Wide-ranging organizations use our tools (software, data, methodologies) to analyze their own data integrated with other data. Follow ProximityOne on Twitter at www.twitter.com/proximityone. Contact ProximityOne (888-364-7656) with questions about data covered in this section or to discuss custom estimates, projections or analyses for your areas of interest. |
|
|