
|
|
|
Related Sections - Situation & Outlook - Applications Gallery - States - Congressional District - School Districts - Counties - Cities/Places - Tracts/Neighborhoods - Block Groups - Census Blocks - Urban Areas Demographic-Economic Estimates-Projections GIS Thematic Mapping Visual Analysis Tools Ranking Tables National Scope Demographic Change 2000-2010 - States - Metros - Congressional District - School Districts - Counties - Cities/Places - Census Tracts |
Metropolitan Area Housing Value & Household Income: 2013-2014
ACS 2013 and 2014 1-year estimates are included in the table for population, median household income and median housing value. The 2014 median housing value-to-median household income is also included. Where do your metros of interest rank? See the interactive table below. 2014 Median Household Income by Metro The following graphic illustrates use of the ACS 2014 data to develop a thematic pattern map of median household income by metro (metros having 65,000 or more population). This graphic makes use of one subject matter item among hundreds of ACS subject matter items tabulated. Click graphic for larger view showing legend and mini profile example. 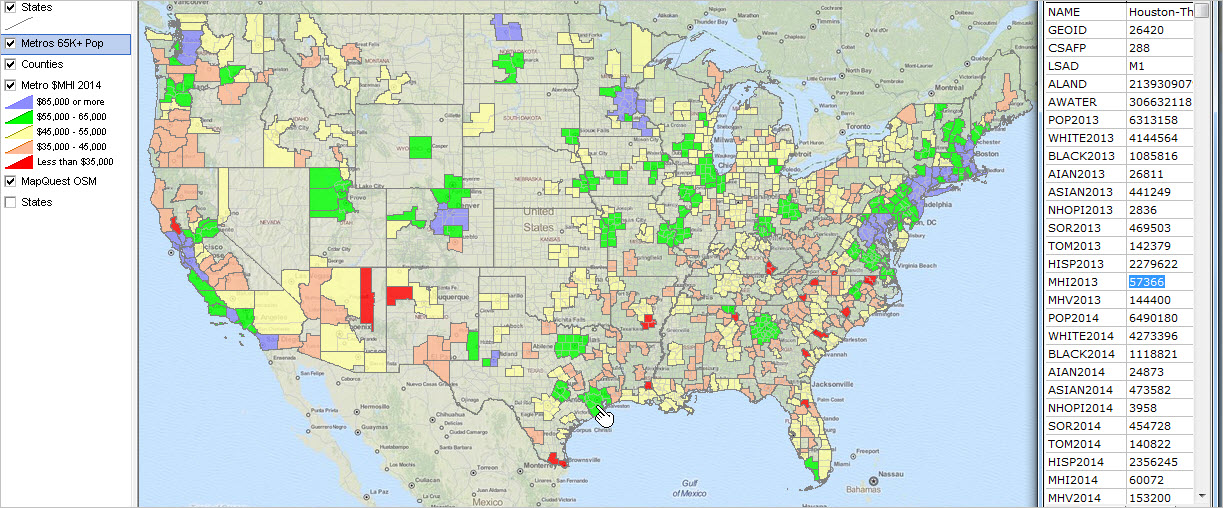 -- view developed using CV XE GIS software and related GIS project. -- see details below on this page for information about the data used to develop the above view Metropolitan Area Housing Value & Household Income: 2013-2014 -- interactive table Click column header to sort; click again to sort other direction. Click ShowAll between queries. Table initially ranked on population 2014 in descending order See related Ranking Tables Main Page Table Usage Columns Name - metro name St - primary state CBSA - Core Based Statistical Area code CSA - Combined Statistical Area code Population 2013 Population 2014 PopCh 2013-14 -- population change 2013-2014 %PopCh 2013-14 -- percent population change 2013-2014 MHI 2013 -- median household income 2013 MHI 2014 -- median household income 2014 MHI Change 2013-14 -- median household income change 2013-2014 %MHI Change 2013-14 -- median household income percent change 2013-2014 MHV 2013 -- median housing value 2013 MHV 2014 -- median housing value 2014 MHV Change -- median housing value change 2013-14 %MHV Change -- median housing value percent change 2013-14 MHV/MHI 2014 -- ratio of median housing value to median household income -- 2014 About the GIS Project & ACS 2014 Dataset The ACS 2014 dataset used to create the view above was developed using the Demographic-Economic Data Extraction (DEDE) software. The DEDE API tools were used to extract ACS 2013 items and ACS 2014 items. Those data were then integrated into a metro shapefile using the CV XE GIS software. Once the 2013 and 2014 data are available, wide-ranging analytics can be performed. The map shown above is one small example. The larger map view profile shows field values for the Houston metro. For example, the MHI2013 (median household income, 2013) for Houston is $57,366 (blue highlighted in graphic) and MHI2014 (median household income, 2014) $60,072. 2014 marks the first time that analysts are able to compare annual change in $MHI (or any other ACS item) by metro (post Census 2010). ACS Items in Shapefile - scroll section A few selected ACS summary file items were extracted. A partial list of items is shown below.
NAME - metro name
GEOID - geocode CSAFP combined statistical area code LSAD - type of metro/CBSA -- MSA or MISA ALAND - land area in square meters AWATER - water area in square meters --- ACS 2013 Items --- POP2013 Total population WHITE2013 White population alone BLACK2013 Black population alone AIAN2013 American Indian/Alaska Native population alone ASIAN2013 Asian population alone NHOPI2013 Native Hawaiian & other pacific islander population alone SOR2013 Some other race TOM2013 Two or more races HISP2013 Hispanic population MHI2013 Median household income MHV2013 Median housing value --- ACS 2014 Items --- POP2014 Total population WHITE2014 White population alone BLACK2014 Black population alone AIAN2014 American Indian/Alaska Native population alone ASIAN2014 Asian population alone NHOPI2014 Native Hawaiian & other pacific islander population alone SOR2014 Some other race TOM2014 Two or more races HISP2014 Hispanic population MHI2014 Median household income MHV2014 Median housing value Support Using these Resources Learn more about demographic-economic data and related analytical tools. Join us in a Data Analytics Lab session. There is no fee for these one-hour Web sessions. Each informal session is focused on a specific topic. The open structure also provides for Q&A and discussion of application issues of interest to participants. ProximityOne User Group Join the ProximityOne User Group to keep up-to-date with new developments relating to metros and component geography decision-making information resources. Receive updates and access to tools and resources available only to members. Use this form to join the User Group. Additional Information ProximityOne develops geographic-demographic-economic data and analytical tools and helps organizations knit together and use diverse data in a decision-making and analytical framework. We develop custom demographic/economic estimates and projections, develop geographic and geocoded address files, and assist with impact and geospatial analyses. Wide-ranging organizations use our tools (software, data, methodologies) to analyze their own data integrated with other data. Follow ProximityOne on Twitter at www.twitter.com/proximityone. Contact ProximityOne (888-364-7656) with questions about data covered in this section or to discuss custom estimates, projections or analyses for your areas of interest. |
|
|