|
|
Urban Population Urban Agglomerations & Census 2010 Workforce Characteristics Place of Work & Residence Situation & Outlook CVXE GIS Tools Data Resources Guide - projections to 2060 Related Sections - Applications Gallery - States - Metros - School Districts - Congressional Dist - Counties - Cities/Places - Tracts/Neighborhoods - Block Groups - Census Blocks - ZIP Codes - Urban Areas Demographic-Economic Estimates-Projections GIS Thematic Mapping Visual Analysis Tools Ranking Tables National Scope Demographic Change 2000-2010 - States - Metros - Congressional District - School Districts - Counties - Cities/Places - Census Tracts |
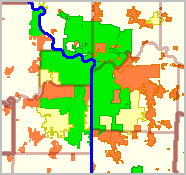
.. examining workers living/working in area .. population change due to commuting & employment/residence ratio The concept of the daytime population refers to the number of people who are present in an area during normal business hours, including workers. This is in contrast to the resident population present during the evening and nighttime hours. Information on the expansion or contraction experienced by different communities/areas between nighttime and daytime populations is important for many planning purposes, including those dealing with market size, trade/service areas, transportation, disaster, and relief operations. Use the interactive ranking table below to examine characteristics of states, counties and cities/places (places with either 2,500 workers living in the place or 2,500 workers working in the place). Data are based on the 2010 ACS 5-year estimates (centric to mid-2008). These data have been updated with 2011 ACS 5-year estimates (centric to 2009) and will update again in December 2013 (centric to mid-2009). These data are the first commuter-adjusted population estimates based on the American Community Survey (ACS) and the first commuter-adjusted population estimates since Census 2000. Other wide-ranging workforce characterictics are available from ACS data down to the block group geographic level. We develop custom estimates and projections of daytime population, for one or many areas, that incorporate results of Census 2010 and trends based on ACS and related data. Contact us for information about custom estimates and projections and/or subscribing to use the data shown in the table on your computer. Mention 'daytime population' in the text section. Employment-Residence (E-R) The far right column (see description of all columns below table) shows the Employment-Residence (E-R) ratio. The E-R Ratio is a measure of the total number of workers working in an area (WrkWrk), relative to the total number of workers living in the area (WrkLiv). The E-R Ratio is a rough indicator of the jobs-workers balance in an area, although it does not take into account whether the resident workers possess the skills needed for the jobs that are available. E-R Ratios greater than 1.00 occur when there are more workers working in the area than living there. These areas can be considered as net importers of labor. City-County-State Daytime Population; 2010 -- interactive ranking table See related interactive tables Click column header to sort; click again to sort other direction. Table Usage Notes • Click on a column header to sort on that column; click column header again to sort in other direction. • Use vertical scroll bar (far right) to scroll vertically. • Mouseover column headers to view description of item. • Click ShowAll button to show all areas and restore full set of data view. • Use horizontal scroll bar to view columns to right (such as E-R Ratio). Left 6 columns remain fixed. • Click State (dropdown below table) to view areas in a selected state (click ShowAll between selections). • Right-click a row, then click Copy to copy to clipboard ... then paste to desired application, e.g., spreadsheet. • Find by Name: key in partial area name in text box to right of Find-in-Name button then click button to locate all matches (case sensitive). • See related ranking tables. Example: Examining Texas Cities 50,000 Population and Over • Click ShowAll button. • Click State dropdown below table and choose Texas. • Click Sumlev dropdown below table and choose 155 City/Place. • Click ResPop 50,000+ button below table. • Click SelectedCols button below table. • Dbl-click on %DayPop... column header cell twice to rank in descending order. • The table should show that Richardson has the highest percent increase. ... repeat process for counties or a state of interest. Definitions & Computing Estimates Worker -- workers are civilians and members of the Armed Forces, 16 years and over, who were at work the previous week at the time of completing the survey. Persons on vacation or not at work the prior week are not included. Total Area Population/Residents -- the resident population is defined as the number of people living in a specified geography. Total workers working in area -- the total number of workers working in an area includes all workers who indicate a specified area as their place of work regardless of where they live. Total workers living in area -- the total workers living in a specified geography is defined as the number of workers who are also residents. This estimate does not reflect location of work. Columns/Data Items and Relationships of Measures ResPop Total resident population – total number of persons living in area as shown in ACS. WrkWrk Total workers working in the area – number of workers who reported working in area, regardless of their place of residence. It is the total that worked there no matter where they lived. Residence locations are not considered, only workplace locations are reflected in this number. WrkLiv Total workers living in the area – sometimes referred to as number of resident workers. It is the number of people living in the area who are workers. It includes workers who live there regardless of where they worked, no matter where their workplace was located. Place of work location is not considered, only residence location is reflected in this number. DayPop Estimated daytime population – estimate arrived at by adjusting total resident population by number of incommuters and outcommuters to the area, using data from the American Community Survey. It does not adjust for people entering or leaving the area for purposes other than commuting, nor does commuting adjustment take time of day of the work trips into account. The estimate is calculated by adding the total resident population (ResPop) and the total workers working in the area (WrkWrk), and then subtracting from that result the total workers living in the area (WrkLiv). This method yields the same result as would be obtained by adding the incommuters and subtracting the outcommuters from the total resident population. DayPopCm Daytime population change due to commuting – numeric increase or decrease in population of area as a result of work-related commuting. It is the net change in the population due to work travel and is computed by subtracting the total resident population (ResPop) from the estimated daytime population (DayPop). Positive numbers indicate more commuters entering the area than leaving it. Negative numbers occur when more workers leave the area to go to work than enter it to come to work. %DayPopCm Percent daytime population change due to commuting – percentage increase or decrease in the population of the area as a result of work-related commuting. It is calculated by dividing the numeric change due to commuting (DayPopCm) by the total resident population (ResPop), and multiplying the result by 100. Positive figures denote the percentage increase experienced by the population, negative numbers show the percentage decrease in the population as a result of commuting. WrkSame Workers who lived and worked in the same area – shows how many workers who lived in a particular area also worked in that same area. It is derived from place of residence location information and responses to the question on workplace location during the week prior to filling out the ACS questionnaire. %WrkSame Percent workers who lived and worked in the same area – sometimes used as an indicator of worker retention, but it does not reflect variation in area size or other attributes very well. It is computed by dividing the number of workers who lived and worked in the same area (WrkSame) by the total workers living there (WrkLiv) and multiplying the result by 100. E-R Ratio Employment-residence (E-R) ratio – measure of total number of workers working in the area (WrkWrk), relative to the total number of workers living in the area (WrkLiv). It is often used as a rough indication of the jobs-workers balance in an area, although it does not take into account whether the resident workers possess the skills needed for the jobs that are available. E-R ratios greater than 1.00 occur when there are more workers working in the area than living there. These areas can be considered as net importers of labor. For example, an E-R ratio of 1.19 means that there are 19 percent more workers working in the area than living in the area. Values less than 1.00 indicate areas that send more workers to other areas than they receive, i.e., they are net exporters of labor. Visual Analysis of Daytime Population Patterns The following graphic shows the Kansas City MSA (brown boundary) with county labels. E-R values associated with thematic pattern view of cities are shown at the left in the legend panel. The E-R ratio of 1.2 or higher (green fill pattern) means that there are 20 percent more workers working in the city than living in the city. Use the CV XE GIS software and the daytime demographics datasets to visually examine your areas of interest. Contact us for more information. Mention 'daytime population visual analysis' in the text section. 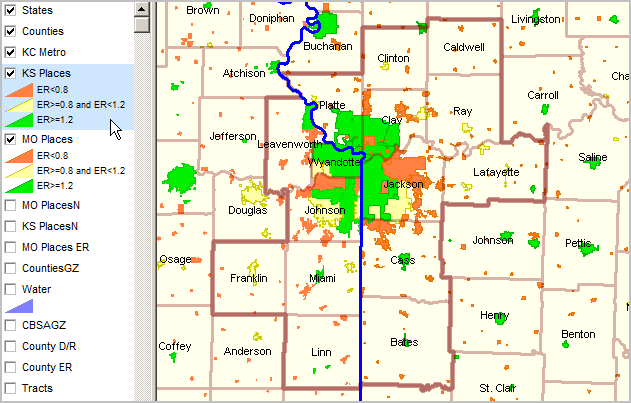
Additional Information ProximityOne develops geodemographic-economic data and analytical tools and helps organizations knit together and use diverse data in a decision-making and analytical framework. We develop custom demographic/economic estimates and projections, develop geographic and geocoded address files, and assist with impact and geospatial analyses. Wide-ranging organizations use our tools (software, data, methodologies) to analyze their own data integrated with other data. Contact Proximity (888-364-7656) with questions about data covered in this section or to discuss custom estimates, projections or analyses for your areas of interest. |
|
|