|
|
|
|
113th/114th Congressional District Urban-Rural Characteristics ... resources to assess the state of economy, social patterns, education and special interests
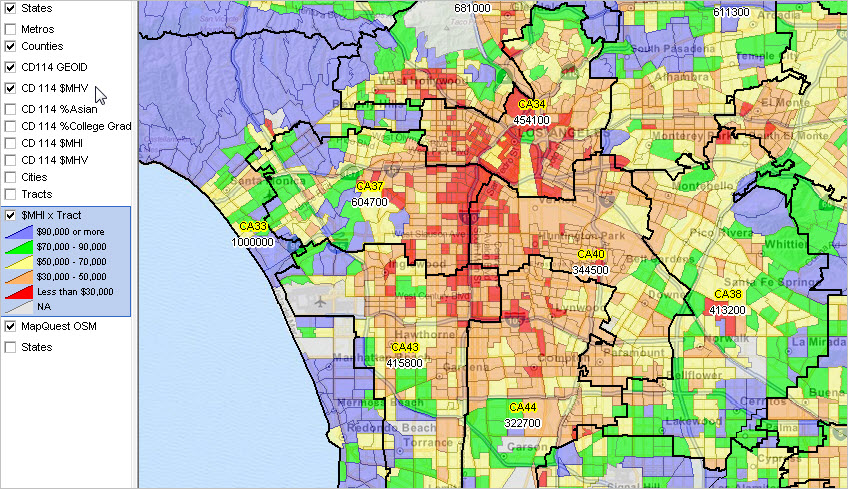
155 of the 113th/114th Congressional Districts were 95% urban or more. More than half of the districts were 86% or more urban. 34 districts were more than 50% rural. The most rural district was 76.5% rural. See related urban/rural patterns by state legislative district -- http://proximityone.com/sld2013.htm. "Urban" and "rural" refer to the urban/rural character of the population. The population in urban census blocks is defined as urban for purposes of this section. See more about urban/rural definition and concepts. Maps & Visual Pattern Analysis Examine individual congressional district thematic maps of economic prosperity (median household income) by neighborhood/census tract. View maps now ... choose by state or select district from contents: http://proximityone.com/cdgallery/guide/overview.htm Use the U.S. by 113th/114th Congressional Districts shapefile with CV XE GIS, or other GIS software, to create thematic pattern maps such as the one shown at right. 113th/114th Congressional Districts Urban/Rural Interactive Table Click column header to sort; again to sort other direction. See usage notes below table. See related Ranking Tables Main Page Using the Ranking Table • Click on a column header to sort on that column; click column header again to sort in other direction. • Click ShowAll button to show all areas and restore full set of data view. • Click State to select all areas in a selected state (click ShowAll between selections). • View additional rows/areas by sliding vertical scrollbar at table right. • Modify column width by dragging column separator in header row. • View additional columns by sliding horizontal scrollbar (leftmost columns remain fixed). Defining Urban and Rural The population in urban census blocks is defined as urban for purposes of this section. How can the Wyoming population be 65% urban? As an example ... see in table above. There are 16,147 census blocks in Wyoming that are urban and whose land area is approximately 195 square miles with population of 364,993. There are 70,057 census blocks in Wyoming that are rural and whose land area is approximately 96,899 square miles with population of 198,633. The population that is urban (population in urban blocks) is approximately 65% of the state (100*364993/(364993+198633)). All terms and numbers here relate to Census 2010. Data in this section were developed using the Census 2010 Summary File 1 (SF1) data. The urban/rural vintage SF1 (released September 2012) contains an urban/rural indicator for each of the more than 11 million census blocks. ProximityOne coded each census block record with the 113th Congressional District code. The block level population and housing data were then aggregated into urban and rural population and housing unit counts for each 113th Congressional District. Support Using these Resources Learn more about demographic economic data and related analytical tools. Join us in a Data Analytics Lab session. There is no fee for these Web sessions. Each informal session is focused on a specific topic. The open structure also provides for Q&A and discussion of application issues of interest to participants. ProximityOne User Group Join the ProximityOne User Group to keep up-to-date with new developments relating to geographic-demographic-economic decision-making information resources. Receive updates and access to tools and resources available only to members. Use this form to join the User Group. Additional Information ProximityOne develops geographic-demographic-economic data and analytical tools and helps organizations knit together and use diverse data in a decision-making and analytical framework. We develop custom demographic/economic estimates and projections, develop geographic and geocoded address files, and assist with impact and geospatial analyses. Wide-ranging organizations use our tools (software, data, methodologies) to analyze their own data integrated with other data. Follow ProximityOne on Twitter at www.twitter.com/proximityone. Contact ProximityOne (888-364-7656) with questions about data covered in this section or to discuss custom estimates, projections or analyses for your areas of interest. |
|
|