
|
|
|
2014 State Legislative Districts -- examining geographic-demographic-economic characteristics and patterns
January 2016. The importance of understanding the demographic-economic make-up and patterns for state legislative districts can hardly be overstated. Community and neighborhood challenges and opportunities are shaped by demographic-economic dynamics. Legislative district incumbents and stakeholders need this information to assess conditions and plan to meet the needs of residents. Only by knowing "where we are" can we develop the most effective plans for improvement. State legislative districts are diverse; they range in population size from 2,706 to 971,140. The median age ranges from 19.5 years to 63.7 years. Use the interactive table below to view other demographic characteristics. Compare districts of interest. New York Metro House Districts & Economic Prosperity by ZIP Code Illustrative GIS application showing legislative districts contextually with other geography & subject matter. House districts black boundary & district code; patterns of median household income by ZIP code. 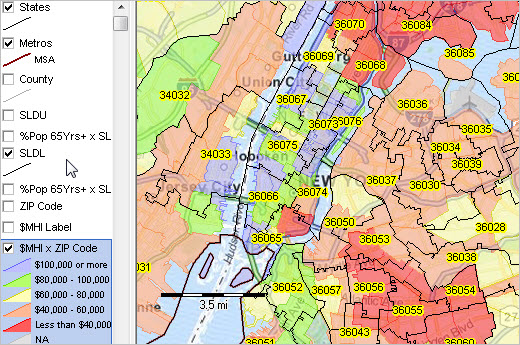 - View developed using CV XE GIS and related GIS project. - see below in this section about using this GIS project. See these related State Legislative Districts (SLD) sections: • SLD Demographic-Economic Interactive Tables • SLD Demographic-Economic GIS Project/Datasets Support Using these Resources Join us in a Data Analytics Lab session. There is no fee for these one-hour Web sessions. Each informal session is focused on a specific topic. The open structure also provides for Q&A and discussion of application issues of interest to participants. ProximityOne User Group Join the ProximityOne User Group to keep up-to-date with new developments relating to geographic-demographic-economic decision-making information resources. Receive updates and access to tools and resources available only to members. Use this form to join the User Group. Additional Information ProximityOne develops geographic-demographic-economic data and analytical tools and helps organizations knit together and use diverse data in a decision-making and analytical framework. We develop custom demographic/economic estimates and projections, develop geographic and geocoded address files, and assist with impact and geospatial analyses. Wide-ranging organizations use our tools (software, data, methodologies) to analyze their own data integrated with other data. Follow ProximityOne on Twitter at www.twitter.com/proximityone. Contact ProximityOne (888-364-7656) with questions about data covered in this section or to discuss custom estimates, projections or analyses for your areas of interest. |
|
|