
|
|
|
K-12 Public Schools 2012-13 by Urban/Rural Status
October 2014. As of Census 2010, 80.7% of the U.S. population lived in urban areas. Of the approximate 90,543 K-12 2012-13 regular public schools in the U.S., 64,970 schools are located in urban areas: • Urbanized Areas (UAs): 52,837 • Urban Clusters (UCs): 12,133 The remaining 25,573 schools (28.2%) are located in rural areas. These data are based on the preliminary 2012-13 school data reported by state education agencies. Use the interactive table in this section to determine the urban/rural status of a school based on the Census Bureau urban/rural criteria. We developed the data in the table by 1) determining the census block in which the school is located, 2) determining the urban/rural status of that census block, and finally 3) associating that census block with corresponding urban area code for those schools in urban areas. This section uses Frisco ISD, TX school district, located in the Dallas, TX metro area, to visually illustrate urban/rural relationships. See related Frisco ISD by attendance zone section for more detail about urban/rural patterns and attendance zones. Defining Urban/Rural Geography and Census Blocks For Census 2010, an urban area is a densely settled core of census tracts and/or census blocks that meet minimum population density requirements, along with adjacent territory containing non-residential urban land uses as well as territory with low population density included to link outlying densely settled territory with the densely settled core. To qualify as an urban area, the territory identified according to criteria must encompass at least 2,500 people, at least 1,500 of which reside outside institutional group quarters. Rural encompasses all population, housing, and territory not included within an urban area. A census block is the smallest geographic tabulation area and is classified as either all urban or all rural. More about census blocks. Examining Patterns in the Dallas, TX Metro Area The following view shows school districts (bold black boundaries) located in the Dallas, TX metro area. Frisco ISD school district is shown toward the center of the map. Urban areas are shown with an orange fill pattern. Urban schools, using a census block definition, appear as orange markers; rural schools appear as green markers. Note that there are four rural schools in Frisco ISD. These four schools also have NCES locale code of 41. The NCES locale code is an alternative measure of urban-centric geographic location. A locale code of 41 is defined as Rural, Fringe: Census-defined rural territory that is less than or equal to 5 miles from an urbanized area, as well as rural territory that is less than or equal to 2.5 miles from an urban cluster). 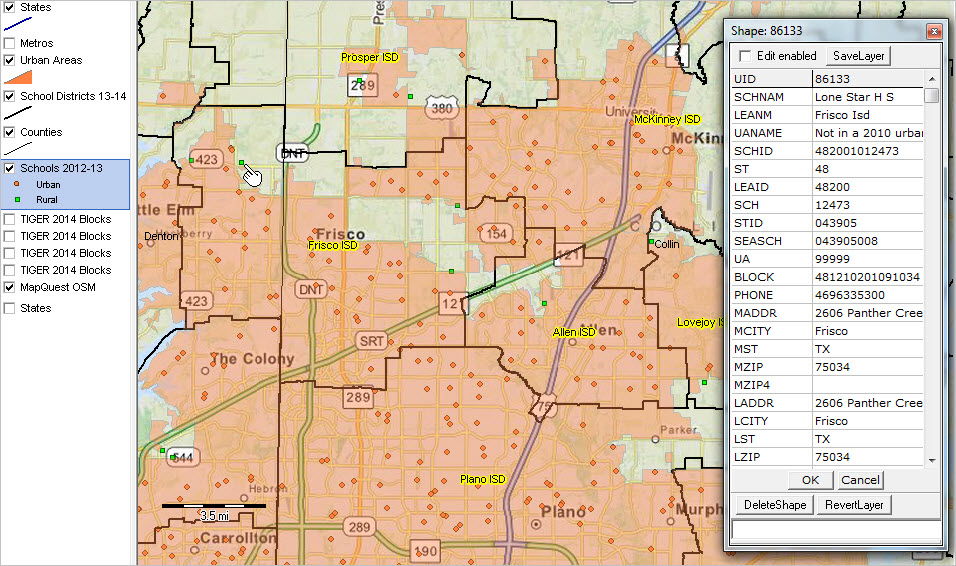 Click graphic for larger view and details. View developed using CV XE GIS and related GIS project. See related state views below. See the pointer at the rural school in the expanded view (click above graphic). The identify tool is used to click on this school and display a mini-profile (shown in in right section of map panel). The profile shows the name and various attributes for the school including the location census block code (BLOCK: 48-121-020109-1034) and the urban area code (UA:99999). 99999 is the code for 'not in an urban area.' Similar visual analyses can be examined for any school. K-12 Public Schools 2012-13 by Urban/Rural Status Interactive Table ... rank by column This table may initially require 15-30 seconds to load, depending on your connectivity. Click column header to sort; click again to sort other direction; Click ShowAll button between queries. See related Ranking Tables Main Page Usage Notes • Click on a column header to sort on that column; click column header again to sort in other direction. • Click ShowAll button to show all areas and restore full set of data view. • Click State to view a selected state (click ShowAll between selections). • Find ZIP: key in ZIP code in text box to right of Find ZIP then click button to locate all matches based on ZIP Code column. • Find School Name: key in partial school name in text box to right of Find School Name then click button to locate all matches (case sensitive) based on school name column. • Find LEA Name: key in partial local education agency (LEA) name in text box to right of Find LEA Name button then click button to locate all matches (case sensitive) based on LEA name column. State Views Missouri 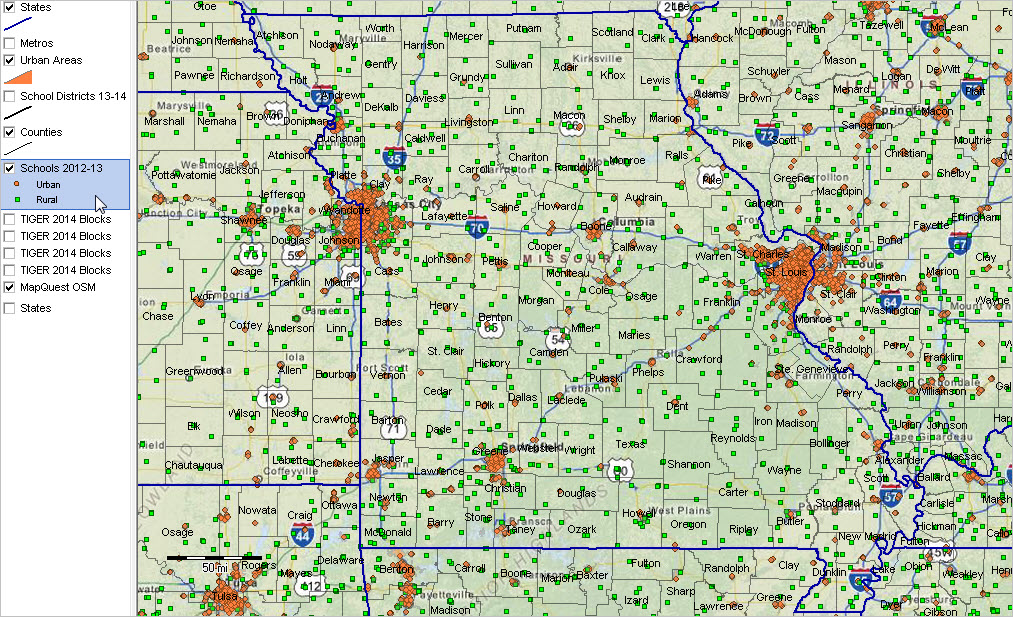 Click graphic for larger view and details. View developed using CV XE GIS and related GIS project. ProximityOne User Group Join the ProximityOne User Group to keep up-to-date with new developments relating to children's demographics and school district decision-making information resources. Receive updates and access to tools and resources available only to members. Use this form to join the User Group. There is no fee. Support Using these Resources Learn more about demographic economic data and related analytical tools. Join us in a Decision-Making Information Web session. There is no fee for these one-hour Web sessions. Each informal session is focused on a specific topic. The open structure also provides for Q&A and discussion of application issues of interest to participants. Additional Information ProximityOne develops geographic-demographic-economic data and analytical tools and helps organizations knit together and use diverse data in a decision-making and analytical framework. We develop custom demographic/economic estimates and projections, develop geographic and geocoded address files, and assist with impact and geospatial analyses. Wide-ranging organizations use our tools (software, data, methodologies) to analyze their own data integrated with other data. Follow ProximityOne on Twitter at www.twitter.com/proximityone. Contact ProximityOne (888-364-7656) with questions about data covered in this section or to discuss custom estimates, projections or analyses for your areas of interest. |
|
|