
|
|
|
The approximate 100,000 K-12 school attendance zones are defined by individual school districts based on the respective state guidelines. The demographic-economic composition, and trends, of individual school attendance zones are of great interest to those including individual homeowners and residents, businesses making location decisions, neighborhood associations, school districts themselves, as well as various government operations at Federal, state and local levels. This section provides a description of resources available to support School Attendance Zone (SAZ) analysis and interactive access to part of the SAZ geographic-demographic-economic data available. Use the interactive table in this section to view, compare, rank SAZs based on demographic attributes provided for each SAZ. See more about these data (below, in this section). Philadelphia Elementary School Attendance Zones -- patterns of median household income 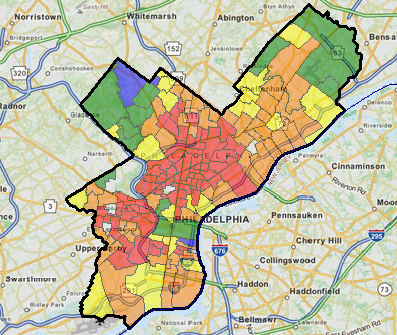 See additional maps below table in this section and related details. School Attendance Zone General Demographics -- Interactive Table Click column header to sort; click again to sort other direction. This table shows only general demographics (age, gender, race/origin); additional richer demographics also available. Usage Notes • All other items are estimates centric to mid-2008 (ACS 2006-10 5 year estimates). • Filter on School Level. - Click ShowAll button first. - Choose School Level (SchLev) in dropdown below table. - Filters on column 7 for the selected school level. • Use FindInName to find a school by name. - Click ShowAll button first. - Key in any part of name and click FindInName button. - Search will filter for any name (column 2) with that exact, case sensitive, spelling. - Houston is used as an example; many schools with the name Houston are located. • Use FindDistrictID to find all schools in a school district. - Click ShowAll button first. - Key in exact 7-character Federal school district code and click FindDistrictID button. - Search will filter for any school with that district ID (column 5). - 4814280 (Clear Creek ISD TX) is used as an example. - See school district interactive table to find the school district code. - Selected district codes
California
• Selected columns buttonsLos Angeles, CA: 0622710 Kansas Wichita USD, KS: 2012990 Maryland Montgomery County Schools, MD: 2400480 New York Rochester, NY: 3624750 Texas McKinney ISD TX: 4829850 Virginia Alexandria Schools, VA: 5100120 Fairfax County Schools, VA: 5101260 - Click Set1 button shows selected descriptor items, total population, median age and total housing units. • Click ShowAll button between specific queries. • Cells with -1 value indicate this value was not estimated (for this geography and this time frame). General Demographics Items This scroll section describes items shown in the above table. Most items in the table are presented as a percent of total population.
AGE AND GENDER
D001 Total population D002 Male D003 Female D004 Under 5 years D005 5 to 9 years D006 10 to 14 years D007 15 to 19 years D008 20 to 24 years D009 25 to 34 years D010 35 to 44 years D011 45 to 54 years D012 55 to 59 years D013 60 to 64 years D014 65 to 74 years D015 75 to 84 years D016 85 years and over D017 Median age (years) D018 18 years and over D019 21 years and over D020 62 years and over D021 65 years and over D022 18 years and over D023 Male D024 Female D025 65 years and over D026 Male D027 Female RACE D028 Total population D029 One race D030 Two or more races D031 One race D032 White D033 Black or African American D034 American Indian and Alaska Native D035 Cherokee tribal grouping D036 Chippewa tribal grouping D037 Navajo tribal grouping D038 Sioux tribal grouping D039 Asian D040 Asian Indian D041 Chinese D042 Filipino D043 Japanese D044 Korean D045 Vietnamese D046 Other Asian D047 Native Hawaiian and Other Pacific Islander D048 Native Hawaiian D049 Guamanian or Chamorro D050 Samoan D051 Other Pacific Islander D052 Some other race D053 Two or more races D054 White and Black or African American D055 White and American Indian and Alaska Native D056 White and Asian D057 Black or African American and American Indian and Alaska Native Race alone or in combination with one or more other races D058 Total population D059 White D060 Black or African American D061 American Indian and Alaska Native D062 Asian D063 Native Hawaiian and Other Pacific Islander D064 Some other race HISPANIC OR LATINO AND RACE D065 Total population D066 Hispanic or Latino (of any race) D067 Mexican D068 Puerto Rican D069 Cuban D070 Other Hispanic or Latino D071 Not Hispanic or Latino D072 White alone D073 Black or African American alone D074 American Indian and Alaska Native alone D075 Asian alone D076 Native Hawaiian and Other Pacific Islander alone D077 Some other race alone D078 Two or more races D079 Two races including Some other race D080 Two races excluding Some other race, and Three or more races D081 Total housing units Using SAZ Boundary Files & Related Geodemographics The following views illustrate use of the SAZ boundary files with related geography and associated demographics. The CV XE GIS software is used to develop these views and corresponding GIS project fileset are available to ProximityOne User Group members (join, no fee). These applications illustrate how point location and geographic area attributes, multi-sourced data, can be integrated and geospatially analyzed. Montgomery County Public Schools MD Area School Attendance Zones Part of the Washington, DC metro, the school district boundary is shown by the pointer. A query has been placed on the SAZ layer so that only elementary SAZ boundaries are shown. 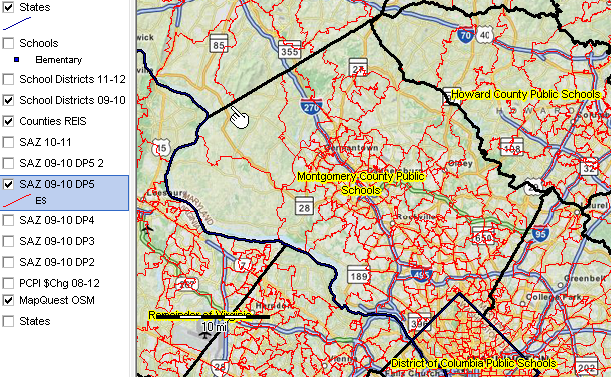
By clicking on the school marker layer, schools are shown by blue markers. A query has been placed on the schools layer so that only elementary schools are shown. 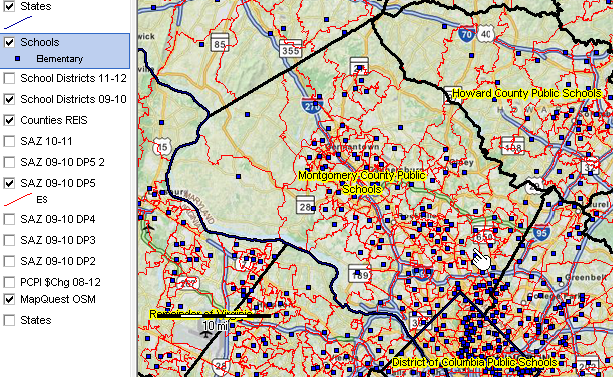
The next view shows a zoom-in to the area shown by the pointer in the above graphic. One SAZ label (yellow) shows the SAZ name. A second SAZ label (white) shows the total population. The demographic label could be any of hundreds of subject matter items available. The Kemp Mill school marker is clicked showing a profile for the school (partial view) 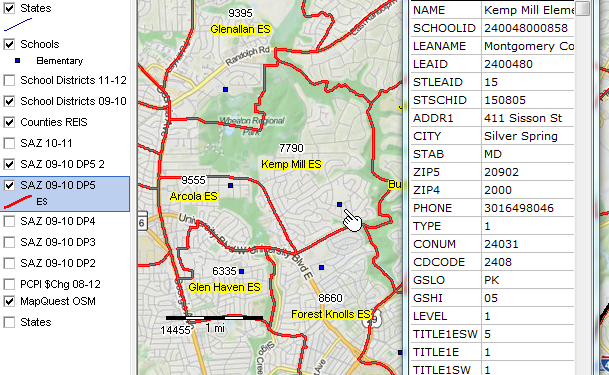
Characteristics of SAZ Demographics in Adjacent Districts The next graphic shows SAZ boundaries for Alief ISD, TX and adjacent Houston, TX area school districts. This view illustrates that the same types of school/SAZ analyses in Maryland can be applied elsewhere in the nation due to the use of standardized approaches to the geography and demographics. A peer group of SAZs might be comprised of SAZs with common attributes but in different school districts -- nearby or far away. These resources enable school district leadership, analysts and stakeholders to better understand SAZ demographic attributes. 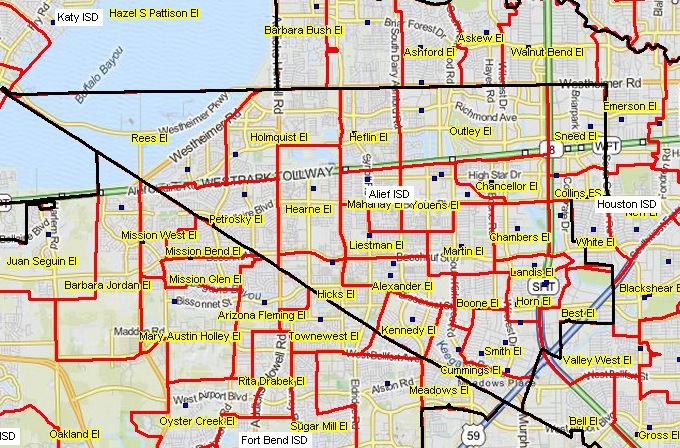
SAZ Demographics The interactive table on this page (above) shows only the "General Demographics" subject matter items. Richer demographic-economic data are also available. The scope of SAZ subject matter is similar to that provided now in school district tables and profiles: • General Demographics -- http://proximityone.com/sd11dp1.htm • Social Characteristics -- http://proximityone.com/sd11dp2.htm • Economic Characteristics -- http://proximityone.com/sd11dp3.htm • Housing Characteristics -- http://proximityone.com/sd11dp4.htm About the Data & Usage School attendance zones are part of an important collection of small area geographies useful to understand demographic-economic patterns, characteristics and trends. Related geographies include census blocks, census block groups, census tracts, ZIP code areas and school districts. A School Attendance Zone (SAZ) is a geographic area served by an individual K-12 school. The SAZ geographic and demographic-economic data are used by schools, school districts, researchers, policy makers and other stakeholders to examine relationships between areas served by schools and related geographic areas (e.g., city/county). Wide-ranging decision-making is made possible by visually examining school catchment areas with related geography and demographic-economic measures. Needs of the school age population can be better analyzed resulting in possible improved educational outcomes. Characteristics of the population served by a school, and its special needs, can be better understood. Awareness of the number of students in areas hit hard by natural disasters could aid relief efforts; the Department of Homeland Security can use this information for planning disaster relief programs in case of a national disaster. These resources can aid school districts in analyzing need and distributing funds/resources to schools within its system. Support Using these Resources [goto top] Learn more about demographic economic data and related analytical tools. Join us in a Data Analytics Lab session. There is no fee for these Web sessions. Each informal session is focused on a specific topic. The open structure also provides for Q&A and discussion of application issues of interest to participants. ProximityOne User Group [goto top] Join the ProximityOne User Group to keep up-to-date with new developments relating to geographic-demographic-economic decision-making information resources. Receive updates and access to tools and resources available only to members. Use this form to join the User Group. Additional Information ProximityOne develops geodemographic-economic data and analytical tools and helps organizations knit together and use diverse data in a decision-making and analytical framework. We develop custom demographic/economic estimates and projections, develop geographic and geocoded address files, and assist with impact and geospatial analyses. Wide-ranging organizations use our tools (software, data, methodologies) to analyze their own data integrated with other data. Contact us (888-364-7656) with questions about data covered in this section or to discuss custom estimates, projections or analyses for your areas of interest. |
|
|