
|
|
|
School Attendance Zone Patterns illustrative applications focused on Frisco ISD, Texas
Examining school attendance zone demographics ... how do attendance zone household characteristics relate to performance and educational outcomes? This section illustrates use of the CV XE GIS software with Frisco ISD, TX school district attendance zone geography and demographics. Views show urban areas and K-12 schools by urban/rural status. More about school attendance zone shapefiles. Frisco ISD in Context of Dallas Urbanized Area Dallas Urbanized Area shown with orange fill pattern. Frisco ISD located at pointer; top center. 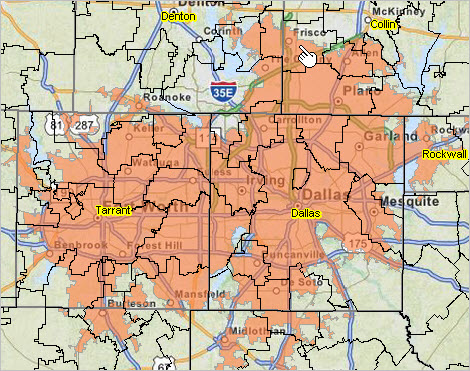 View developed using CV XE GIS and related GIS project. Frisco ISD Elementary School & Middle School Attendance Zones School districts shown with bold black boundaries. Urban areas shown with orange fill pattern. Urban/rural schools shown with markers. Elementary school zones black boundaries; middle school zones red boundaries. 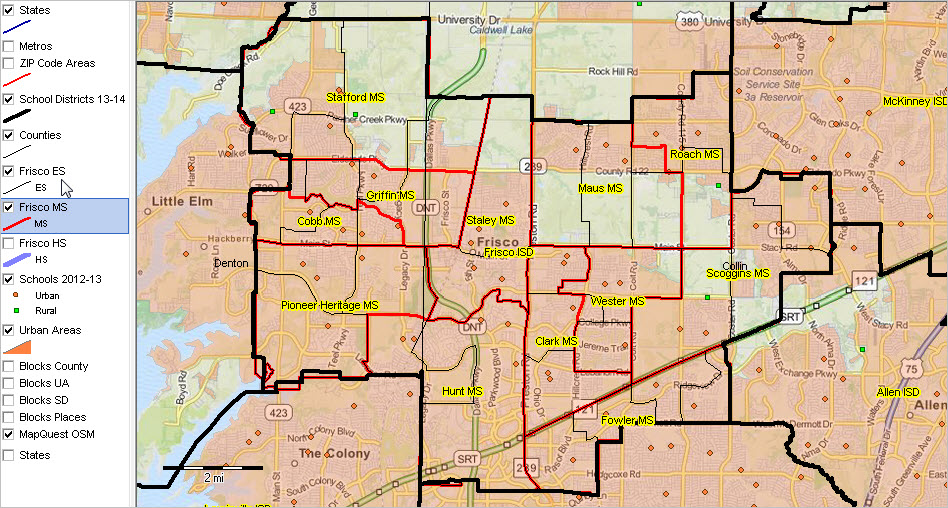 Click graphic for larger view and details. View developed using CV XE GIS and related GIS project. Frisco ISD Christie Elementary Zoom-In Pointer located at Christie ES. Identify tool used to show profile of school. School located in census block 48-085-030404-4003. Urban areas shown with orange fill pattern. Urban/rural schools shown with markers. Elementary school zones black boundaries (white labels); middle school zones red boundaries (yellow labels). 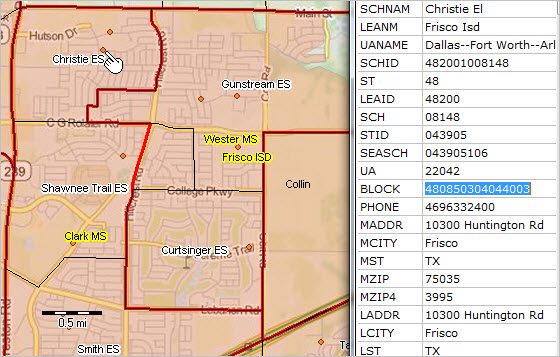 View developed using CV XE GIS and related GIS project. Attendance Zone Demographics The graphic below shows a further zoom-in to Christie MS attendance zone with a census block shapefile layer now active. The CV XE Site Analysis tool is used to select all census blocks intersecting with the attendance zone. These blocks appear with cross-hatched pattern. Grid at lower right shows summary characteristics for the aggregate of these blocks (59 blocks) -- total population (4,759) and total housing units (1,826). Extended demographics for the attendance zone could be developed using any of the Census 2010 Summary File 1 "P" or "H" table items. These attendance zone household demographics can be integrated with local sourced data, such as attendance or performance data by address. Examine the relationship between household demographics and performance or educational outcomes in this attendance zone and/or in comparison with other attendance zones. Insights can help leadership and stakeholders identify and respond to needs resulting in new opportunities for improvement. 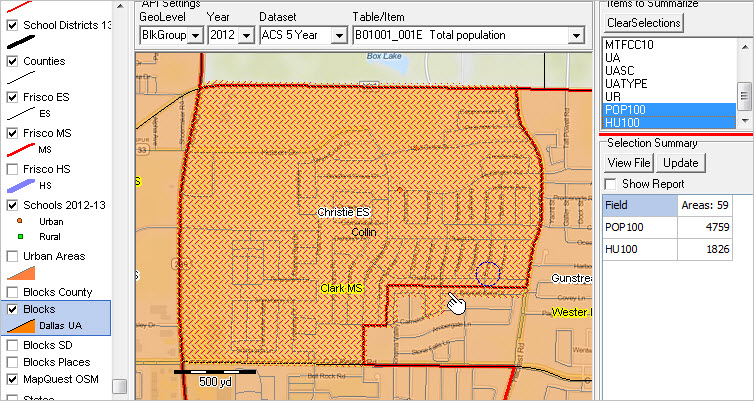 View developed using CV XE Site Analyst and related GIS project. Frisco ISD High School Attendance Zones School districts shown with bold black boundaries. Urban areas shown with orange fill pattern. Urban/rural schools shown with markers. High school zones blue boundaries. 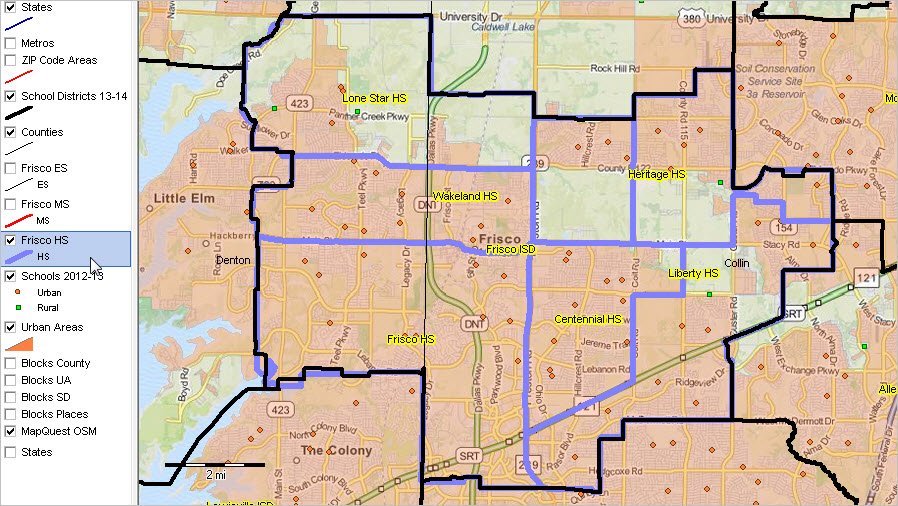 Click graphic for larger view and details. View developed using CV XE GIS and related GIS project. Support Using these Resources Learn more about demographic economic data and related analytical tools. Join us in a Decision-Making Information Web session. There is no fee for these one-hour Web sessions. Each informal session is focused on a specific topic. The open structure also provides for Q&A and discussion of application issues of interest to participants. Additional Information ProximityOne develops geographic-demographic-economic data and analytical tools and helps organizations knit together and use diverse data in a decision-making and analytical framework. We develop custom demographic/economic estimates and projections, develop geographic and geocoded address files, and assist with impact and geospatial analyses. Wide-ranging organizations use our tools (software, data, methodologies) to analyze their own data integrated with other data. Follow ProximityOne on Twitter at www.twitter.com/proximityone. Contact ProximityOne (888-364-7656) with questions about data covered in this section or to discuss custom estimates, projections or analyses for your areas of interest. |
|
|