
|
|
|
School District Urban, Suburban, Rural Classification & Patterns
This section reviews tools and methods to examine school districts classified as urban, suburban or rural. School districts are categorized by a "locale code" that gives insights into the urban, suburban or rural character of individual school districts. Map views presented here have been developed using a GIS project that may be downloaded and used to analyze more detailed characteristics of districts by these categories. The locale code, a 2-digit code assigned to each district, can be used to categorize school districts into one of four major categories: city, suburban, town, and rural. Cities and suburbs are further divided into categories of small, mid-size, or large. Towns and rural areas can be characterized by their proximity to an urbanized area as fringe, distant, or remote. These are codes are developed by the U.S. Department of Education National Center for Education Statistics (NCES). NCES assigns the codes to individual school districts. See more about locale code definitions. Use this interactive table to view the locale code for any particular district and examine sets of peer districts based on the locale code and related demographics. The locale code is an imperfect means of classifying school districts as urban, suburban or rural but offers one important standardized method. Many larger school districts, particularly those that are county-equivalents, are a mix of urban, suburban and rural geography. School Districts by Locale Code
School Districts by Locale Code Maps The maps presented below show the distribution of regular school districts as markers by type of locale code. These maps depict school district locations based on use of a point shapefile. The point shapefile shows the marker location based on the school district mailing address. These views render each school district as the same size (a point) regardless of geographic area covered. These views have been developed using the CV XE GIS software and associated GIS project. Members of the ProximityOne User Group (join now, no fee) may install the no fee software and GIS project. Develop custom zoom-in views, label school districts, perform queries, add your own data, add related geographic layers and perform other types of geospatial operations. School Districts with City Locale Code (11, 12 or 13) 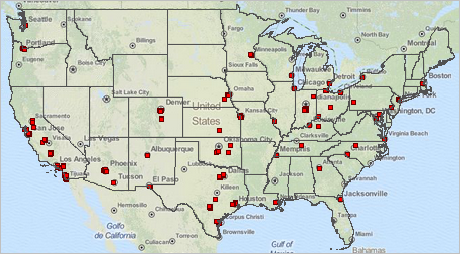
School Districts with Suburban Locale Code (21, 22 or 23) 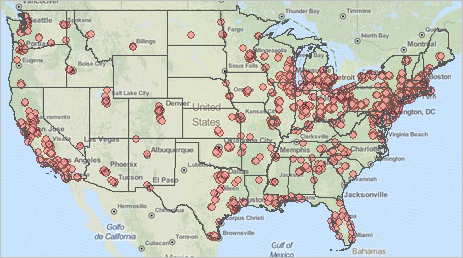
School Districts with Town Locale Code (31, 32 0r 33) 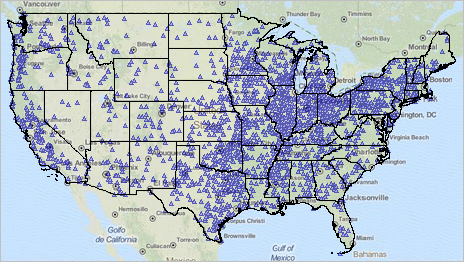
School Districts with Rural Locale Code (41, 42 or 43) 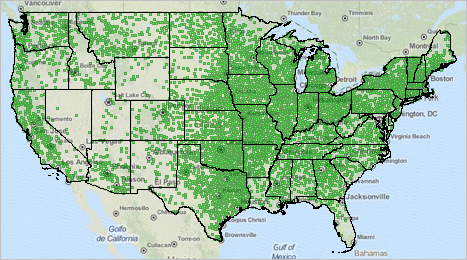
Dallas, TX Region Zoom-in • Shows all 4 types of locale codes as markers. • A school district polygon layer shows boundaries for corresponding locale type markers. 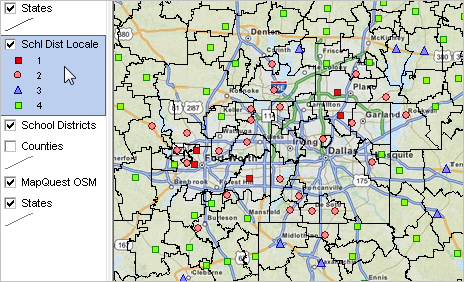
Steps to Develop Custom School District Locale Code Maps (requires Windows computer with Internet connection) 1. Install the ProximityOne CV XE GIS ... run the CV XE GIS installer ... take all defaults during installation 2. Download the U.S. school district locale GIS project fileset ... requires ProximityOne User Group ID (join now, no fee) ... unzip U.S. School District Locale GIS project files to local folder c:\schooldistrictlocale 3. Open the c:\schooldistrictlocale\schooldistrictlocale1.gis project ... after completing the above steps, click File>Open>Dialog ... open the file named c:\schooldistrictlocale\schooldistrictlocale1.gis 4. Done. The start-up view appears similar to map graphics above. Locale Code Definitions
City, Large Territory 11 ... inside an urbanized area and inside a principal city with population of 250,000 or more.
City, Mid-size Territory 12 ... inside an urbanized area and inside a principal city with a population less than 250,000 and greater than or equal to 100,000. City, Small Territory 13 ... inside an urbanized area and inside a principal city with a population less than 100,000. Suburb, Large Territory 21 ... outside a principal city and inside an urbanized area with population of 250,000 or more. Suburb, Mid-size Territory 22 ... outside a principal city and inside an urbanized area with a population less than 250,000 and greater than or equal to 100,000. Suburb, Small Territory 23 ... outside a principal city and inside an urbanized area with a population less than 100,000. Town, Fringe Territory 31 ... inside an urban cluster that is less than or equal to 10 miles from an urbanized area. Town, Distant Territory 32 ... inside an urban cluster that is more than 10 miles and less than or equal to 35 miles from an urbanized area. Town, Remote Territory 33 ... inside an urban cluster that is more than 35 miles from an urbanized area. Rural, Fringe 41 ... Census-defined rural territory that is less than or equal to 5 miles from an urbanized area, as well as rural territory that is less than or equal to 2.5 miles from an urban cluster. Rural, Distant 42 ... Census-defined rural territory that is more than 5 miles but less than or equal to 25 miles from an urbanized area, as well as rural territory that is more than 2.5 miles but less than or equal to 10 miles from an urban cluster. Rural, Remote 43 ... Census-defined rural territory that is more than 25 miles from an urbanized area and is also more than 10 miles from an urban cluster. Urban and Rural For Census 2010, an urban area is a densely settled core of census tracts and/or census blocks that meet minimum population density requirements, along with adjacent territory containing non-residential urban land uses as well as territory with low population density included to link outlying densely settled territory with the densely settled core. To qualify as an urban area, the territory identified according to criteria must encompass at least 2,500 people, at least 1,500 of which reside outside institutional group quarters. There are types of urban areas: • Urbanized Areas (UAs) of 50,000 or more people • Urban Clusters (UCs) of at least 2,500 and less than 50,000 people "Rural" encompasses all population, housing, and territory not included within an urban area. Additional Information ProximityOne develops geodemographic-economic data and analytical tools and helps organizations knit together and use diverse data in a decision-making and analytical framework. We develop custom demographic/economic estimates and projections, develop geographic and geocoded address files, and assist with impact and geospatial analyses. Wide-ranging organizations use our tools (software, data, methodologies) to analyze their own data integrated with other data. Follow ProximityOne on Twitter at www.twitter.com/proximityone. Contact us (888-364-7656) with questions about data covered in this section or to discuss custom estimates, projections or analyses for your areas of interest. | |||||||||||||||||||||||||||||||||||||||||||||||||||||||||||||||||||||||||||||||||||
|
| ||||||||||||||||||||||||||||||||||||||||||||||||||||||||||||||||||||||||||||||||||||