|
|
Related Sections - Applications Gallery - States - School Districts - Counties - Cities/Places - Block Groups - Census Blocks - ZIP Codes - Urban Areas Demographic-Economic Estimates-Projections GIS Thematic Mapping Visual Analysis Tools Ranking Tables National Scope Demographic Change 2000-2010 - States - Metros - Congressional District - School Districts - Counties - Cities/Places - Census Tracts |
Neighborhood and small area demographic analysis often make use of census tracts. For many counties and regions, census tract boundaries and codes changed substantially between Census 2000 and Census 2010, making for a challenge to compare trends and patterns over time. This section is focused on tools to examine Census 2000 census tracts and view/analyze corresponding Census 2010 census tracts and associated demographics. In this section ... - 2000-2010 Census Tract Comparison Report - Visual Analysis of Census Tract Change - Interpreting Census Tract Change Patterns - Operation of the Census Tract Change Comparison Tools FFIEC -- HMDA & CRA. For example, until mid-2012 financial institutions were required to use Census 2000 census tracts and related demographics to meet various compliance, reporting and analysis requirements associated with the Federal Financial Institutions Examination Council (FFIEC) Home Mortgage Disclosure Act (HMDA) and Community Reinvestment Act (CRA) programs. Now regulations require use of Census 2010 census tracts. The service/assessment area often changes as a result of a new set of census tract boundaries, often with different codes and covering a similar but not identical overall assessment area. Even where the service/assessment area is a whole county, changing tract codes and water/special designation area boundaries can result in change between Census 2000 and Census 2010 census tract boundaries. Many Other Applications. There are many other applications that require knowledge of changing Census 2000 and Census 2010 census tract boundaries. Most local and regional governments must consider these differences in analyzing demographic change. Businesses that have used Census 2000 census tracts for sales or service territory assignment need to redefine the areas with Census 2010 census tracts in order to be able to use Census 2010 and post Census 2010 demographics. Health-related analyses often make use of census tract geography; similar to business related needs, the areas once defined in terms of Census 2000 tract codes must now be defined in terms of Census 2010 census tract codes. Census tracts, averaging 4,000 population cover the U.S. wall-to-wall, are coterminous with county boundaries. See more about census tracts at http://proximityone.com/tracts.htm. 2000 to 2010 Tract Comparison Report The 2000-2010 Tract Comparison Report can be generated using a standalone program or as an integrated feature of the CV XE GIS. With CV XE GIS running, start File>Tools>2000-2010 Tract Comparison Report. The start-up view, using the option of national scope tract files, is shown below. The grid shows a line/row for each Census 2000 tract. The grid is generated based on settings in the left panel. The grid shows attributes of the Census 2000 tracts and corresponding Census 2010 tracts. Operation and use of the tools are reviewed later in this section. 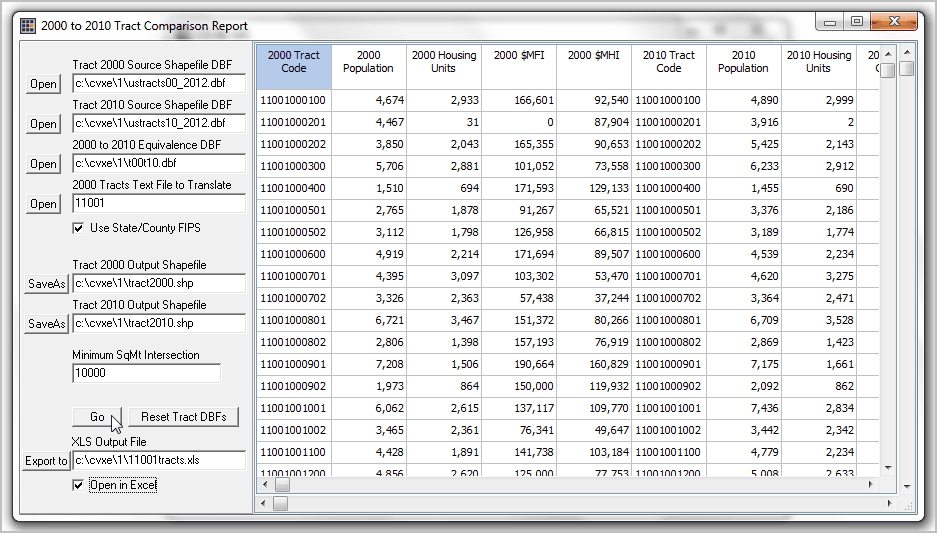
CV XE GIS Overview of Shapefiles Generated -- Examining Changes Visually The following graphic shows a zoom-in view of the Washington DC area using the Census 2000 census tracts (red boundaries and tract labels) and Census 2010 census tracts (gray bold boundaries and black labels) shapefiles developed using the application shown above. The TIGER/Line roads/edges shapefile has been added to show streets. The pointer is located near the White House. 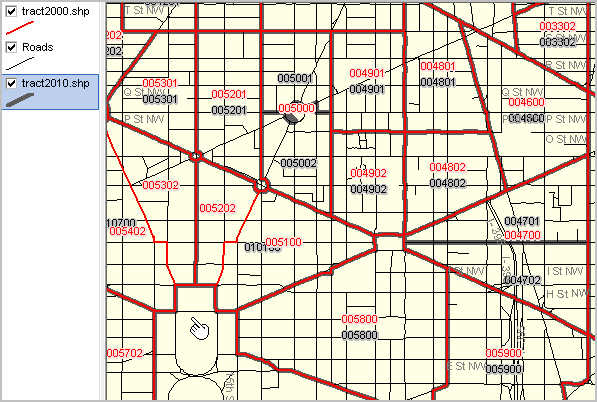
Interpreting Census Tract Change Patterns In the above map view it can be seen ... • Census 2000 tract 004700 (47.00) was split to create Census 2010 tracts 004701 (47.01) and 004702 (47.02). • Census 2000 tract 005000 (50.00) was split to create Census 2010 tracts 005001 (50.01) and 005002 (50.02). • Census 2000 tracts 005202 (52.02) and 005100 (51.00) have been combined to create Census 2010 tract 010100 (101.00). Generally tract splits and combines are not so neat and are split into part tract areas. These tracts are highlighted in the 2000-2010 tract report view from grid shown above (exported to XLS) shown below. 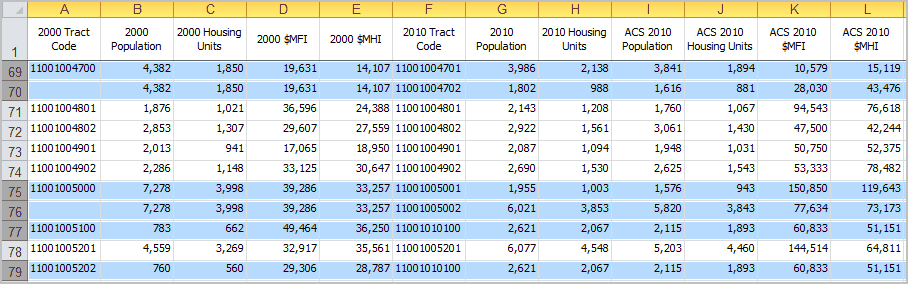
It can be seen that: • 2000 tract 004700 had 2000 population 4,382 and related 2010 tract 004701 had 2010 population 3,982 and 004702 population 1,802. • 2000 tract 005000 had 2000 population 7,278 and related 2010 tract 005001 had 2010 population 1,955 and 005002 population 6,021. • 2000 tract 005100 (2000 pop 738) combined with 005202 (2000 pop 790) to form 2010 tract 010100 (pop 2,621). Overview of Tract Report Grid and Operation Settings are made in the left panel and then the Go button is clicked to start the operations. In this example all Census 2000 census tracts in Washington DC are processed. The grid section (see above view) shows a set of columns for Census 2000 (leftmost 5 columns) followed by a set of corresponding Census 2010 columns. Other columns showing American Community Survey (ACS) 2010 demographics (5 year estimates) and other data are reviewed below. The report is prepared by processing either all Census 2000 tracts in a designated county or a set of tract geocodes provided by the user in a tracts list file. For each Census 2000 input tract geocode, all occurrences of Census 2010 census tract geographic overlap/intersection are located. A row/record for each intersecting combination is written to the grid. Control Section Options Once the Control Section values are set, click the Go button to generate the grid report. These actions are taken when the Go button is clicked and processing proceeds: 1.namelsad00 field in Tract 2000 Source Shapefile DBF tract records updated with Region code for Census 2000 tracts in 2000 Tracts Text File to Translate 2.namelsad10 field in Tract 2010 Source Shapefile DBF tract records updated with Region code for Census 2010 tracts intersecting with Census 2000 tracts in 2000 Tracts Text File to Translate 3. Grid panel generated ... one row for Census 2000 tract and corresponding intersecting Census 2010 tract 4. Tract 2000 Output Shapefile generated. 5. Tract 2010 Output Shapefile generated. Tract 2000 Source Shapefile DBF ustracts00_2012.dbf Census 2000 (TIGER Census 2010 vintage) shapefile structure required. Tract 2010 Source Shapefile DBF ustracts10_2012.dbf Census 2010 (TIGER Census 2010 vintage) shapefile structure required. 2000 to 2010 Equivalence DBF t00t10.dbf National scope Census 2000 to Census 2010 tract equivalence file; intersecting area for 2000 and 2010 tracts. The U.S. master list file is shown in the ranking table at http://proximityone.com/tracts0010.htm. All Census 2000 and Census 2010 tracts are shown in that table but some fields in the t00t10.dbf are omitted. 2000 Tracts Text File to Translate 1 - User supplied list of Census 2000 tracts to be equivalenced or 2 - State-County FIPS code for county to be processed -- used if Use State/County FIPS checked (will process all Census 2000 tracts in specified county) Tract 2000 Output Shapefile Census 2000 tracts shapefile generated default name tract2000.shp Subset of Tract 2000 Source Shapefile Only tracts are included that are in the list of Census 2000 tracts to be processed. Tract 2010 Output Shapefile Census 2010 tracts shapefile generated default name tract2010.shp Subset of Tract 2010 Source Shapefile Only tracts are included that intersect with a Census 2000 tract processed. Minimum SqMt Intersection Specify minimum size of intersecting area between Census 2000 and Census 2010 tract to be included. XLS Output File When Export button is clicked the Grid content is exported to an XLS file. If Open in Excel checkbox is checked, the exported grid XLS is auto opened in Excel. Grid Column Content
Additional Information Proximity develops geographic-demographic-economic data and analytical tools and helps organizations knit together and use diverse data in a decision-making and analytical framework. We develop custom demographic/economic estimates and projections, develop geographic and geocoded address files, and assist with impact and geospatial analyses. Wide-ranging organizations use our tools (software, data, methodologies) to analyze their own data integrated with other data. Contact Proximity (888-364-7656) with questions about data covered in this section or to discuss custom estimates, projections or analyses for your areas of interest. |
|
|