|
|
|
Census 2010 Main Page School District Demographics Main Page |
Data Access & Use Notes by Warren Glimpse Data start to flow for all school districts from American Community Survey (ACS) 2009 in December 2010 and Census 2010 in February 2011. Examining and Modifying Attendance Zones Relating schools to neighborhoods ... one important use of the new Census 2010 and ACS 2009 data will be to examine the demographic makeup of attendance zones and restructuring attendance zones to meet the vision and requirements of individual school districts. See more about this topic below. ACS 2009 Demographics ACS 2009 5 year estimates (2005-09, centric to mid 2007) for all school districts become available in December 2010. • these estimates are for TIGER vintage 2009 geography - for decennial geography these data are for Census 2000 geography - for school district geography these data are for the 2007-08 school year • many school district boundaries have changed and will be reflected in the TIGER vintage 2010 geography (below). • the 5 year estimates will provide "2007" estimates for all BGs, tracts, and school districts (all TIGER vintage 2009). Census 2010 Demographics The first Census 2010 data will be the P.L. 94-171 redistricting data. • these data will be released on a state by state, February-March, 2011. • see this P.L. 94-171 subject matter description (xls). - these tabulations go to block level. - unlike previous censuses, every block summary record has the school district code (2009-10 school year). - this makes it possible to view/analyze school district Census 2010 data & component geography. • note in particular, PL94171 age related data are only 1) 18 years and over and 2) under 18 years. Other Census 2010 data summary data providing age & gender and household summary data. • Summary File and Summary File 2 - see description in calendar. • there are no sample based estimates from Census 2010. Census 2010 TIGER/Geography: Maps & Geospatial Analysis The TIGER vintage 2010 shapefiles will be released on a state flow basis paralleling P.L. 94-171 data • these data will be released on a state by state flow basis, 12/10 through 2/11. - any particular state might be any time, but plan for December even though it might be February. • these are geographic data only; no subject matter are included. - use DMILab Tools to integrate FactFinder sourced (+other) subject matter into shapefiles (+other file types). • reflect boundaries for Census 2010 block and higher level geography tabulation areas. • 2009-10 school district boundaries and all Census 2010 geography available for use with CommunityViewer GIS. ProximityOne Demographics: Current Estimates & Projections 2010 Vintage Estimates and Projections for all school districts, tracts and higher level aggregates • available early 2011 ... more information. • centric to July 1, annual data 2010 through 2015. • developed using ACS 2009 5 year estimates (released 12/2010), P.L. 94-171 data among other data. 2011 Vintage Estimates and Projections for all school districts, tracts and higher level aggregates • available early 2012 ... more information. • centric to July 1, annual data 2010 through 2016 (extended one year over 2010 Vintage). • revised 2010 estimates, new current estimate for 2011, annual projections 2012 through 2016. • developed using ACS 2010 5 year estimates (released 12/2011), Census 2010 data among other data. • data prepared for TIGER vintage 2010/Census 2010 geography; 2009-10 school year. ACS 2009 Special Tabulation Demographics The U.S. Department of Education, National Center for Education Statistics, sponsors development of the ACS School District Special Tabulation (SDST) prepared annually by the Census Bureau. The ACS SDST provides access to a major subset of the ACS 3-year (5-year starting with ACS 2009) estimates for individual school districts. The subject matter tabulations are iterated by these universes shown in the table presented below. Only the 1990 Census SDST, Census 2000 SDST and ACS annual SDST provide data on children's demographics and their living environment (children ages 3 to 19 years, not high school graduate). School District Special Tabulation Universes
"Grade relevant" refers to the population of ages who are in grades offered by the school district. The "grade relevant population ages 5-17 enrolled in public school" closely approximates the public school district enrollment. The following table illustrates the relationship between these data/universes using the total population item for a Texas unified school district. The ACS 2009 will be the first year for which the ACS SDST data will be available for all school districts and the first ACS SDST based on 5-year estimates.
This example shows the total population 1-year estimate of 214,538 compared to the 3-year estimate of 201,449. Access the 1990 Census, Census 2000 and ACS SDST data via the School District Demographics System. The ACS 2009 5-year SDST data will be available on this website in mid-2011. Until then, the most recent ACS SDST are the ACS 2008 3-year estimates and are available for school districts with population 65,000 and over. Examining and Modifying Attendance Zones One important use of the new Census 2010 and ACS 2009 data will be to examine the demographic makeup of attendance zones and restructuring attendance zones to meet the vision and requirements of individual school districts. As a generalization, only the Census 2010 and ACS data can provide needed insights into the demographic makeup of existing or prospectively new attendance zones. While school districts have data on the number of students by grade and school by attendance zone (data group 1), administrative data do not reveal demographics such as household and family characteristics, income and poverty, multi-cultural and language characteristics, workforce and employment attributes, educational attainment and other socioeconomic measures, housing characteristics (data group 2). We need data on these items so that attendance zones can have a balance based on these criteria as well as enrollment data ... and even census data that might be collected by the district. Important resources involved with examining and modifying attendance zones, summarized earlier in this section, include: • Census block demographics from the Census 2010 P.L. 94-171 data -- census blocks are the smallest geographic area for which decennial census data are available. -- census blocks cover the U.S. wall-to-wall. -- aggregate to AZ, planning zone, and district levels • Census block demographics from the Census 2010 Summary File 1 data -- aggregate to AZ, planning zone, and district levels -- only here are the age detail by census block available • Census block group demographics from the Census 2010 PL 94-171 & Summary File 1 data -- aggregate to AZ, planning zone, and district levels -- these are for Census 2010 geography • Census block group demographics from the ACS 2009 (2005-09 5 year estimates) -- aggregate to AZ, planning zone, and district levels -- these are for Census 2000 geography -- these are the data group 2 (see above) • School district administrative data -- data group 1 (see above) • TIGER vintage 2010 -- enables related mapping; geospatial analysis -- geography pertinent to Census 2010 geography (Census 2010 data) • TIGER vintage 2009 -- enables related mapping; geospatial analysis -- geography pertinent to Census 2000 geography (ACS 2009 data) Relating Attendance Zone to Other Types of Geography and Demographics The following map was prepared to illustrate the relationship between voting districts and other types of geography. See the list of geographic definitions that follow the map. Imagine the voting district shown in the map as an attendance zone. Attendance zones are defined only by school districts. Attendance zone boundaries are not a geography defined in any Census (or any other national) digital geography file. Working with attendance zones can be more complicated than with voting districts but some parallels exist. 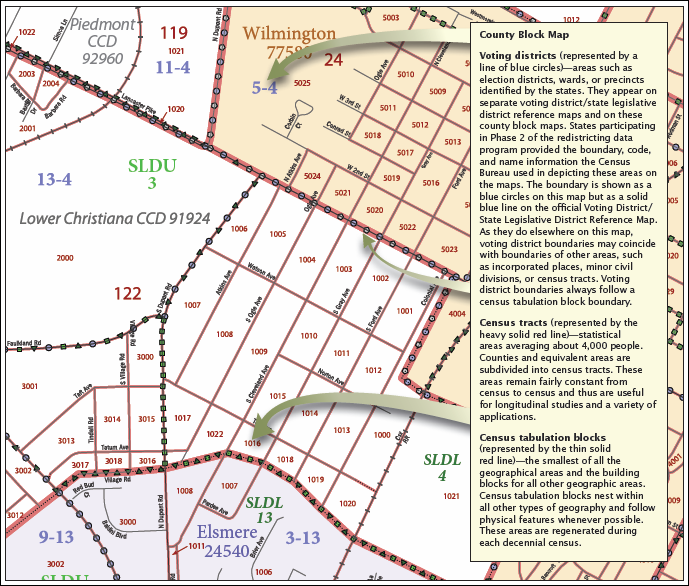
Census tabulation blocks ... smallest of census geographic areas, normally bounded by streets or other prominent physical features or by the boundaries of geographic areas. They may be as small as a typical city block that's bounded by four streets or larger than 100 square miles in some rural areas. Blocks are identified by a four-digit number, unique within census tracts for the 2010 Census. Nationally, blocks average about 100 people each. Block groups ... a set of census blocks identified by the same first digit within a census tract. For example, all blocks in a census tract in the 1000 range define block group 1. Census tracts ... statistical areas averaging about 4,000 people. Counties and equivalent areas are subdivided into census tracts. These areas remain fairly constant from census to census and thus are useful for longitudinal studies and a variety of applications. Join us in an upcoming workshop where you can participate in computer hands-on use of these resources focused on your school districts of interest. Inquire for information about upcoming workshops; watch this section for updates. Additional Information. Proximity develops geodemographic-economic data and analytical tools and helps organizations knit together and use diverse data in a decision-making and analytical framework. We develop custom demographic/economic estimates and projections, develop geographic and geocoded address files, and assist with impact and geospatial analyses. Wide-ranging organizations use our resources (software, data, methodologies) to analyze their own data integrated with other data. | |||||||||||||||||||||||||||||||||||||||||||||||||||||||||||||
|
|