|
|
Register Installation Using FactFinder Pattern Analysis: Median Household Income by Congressional District MetroView Metro GIS Projects Situation & Outlook Estimates & Projections |
DMILab - Decision-Making Information Lab Tools
Use DMILab tools to convert and integrate Census Bureau FactFinder data into your database and GIS applications. More than this, use DMILab tools to convert one type of data file to another format/structure, merge datasets based on user defined keys, select the fields that you want, merge any XLS or dBase data into shapefiles for pattern analysis, thematic mapping and geospatial processing. Proximity develops geographic-demographic-economic data and analytical tools and helps organizations knit together and use diverse data in a decision-making and analytical framework. We develop custom demographic/economic estimates and projections, develop geographic and geocoded address files, and assist with impact and geospatial analyses. Wide-ranging organizations use our tools (software, data, methodologies) to analyze their own data integrated with other data. The no-fee DMILab tools add capabilities to link your data with Proximity and and other data more easily. The DMILab software operates on Win32/64 computers. Download/install DMILab on your computer. We request that you register. Updates This section is updated frequently as DMILab tools and documentation are improved.
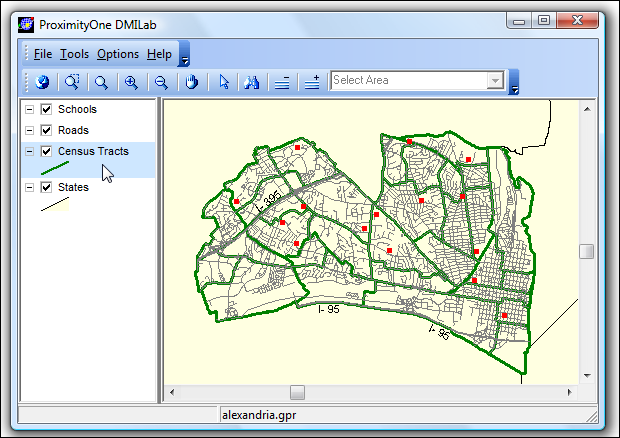
Start-up View
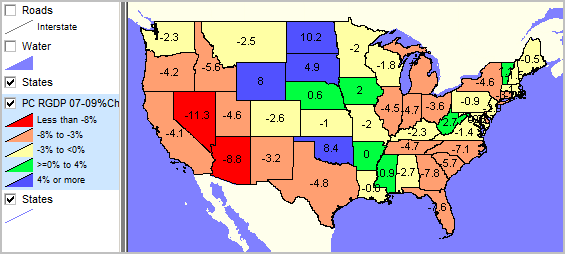
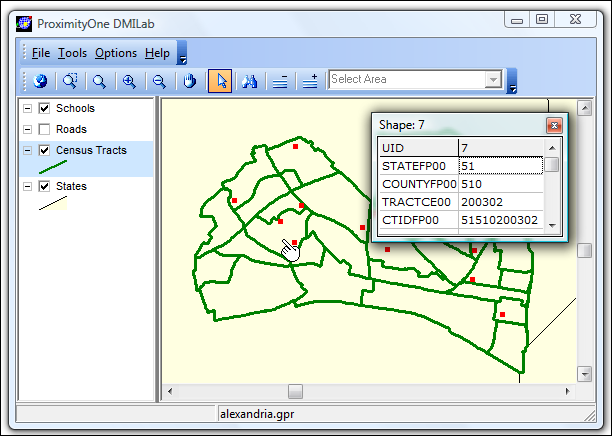
Using DMILab If using DMILab to merge Census Bureau sourced data into shapefiles, these would be the typical steps: 1) Download the desired FactFinder subject matter data. e.g., "c:\dmilab\qt_dec_2000_sf1_u_data1.xls" discussed below 2) Use DMILab File>GeoGateway to download corresponding shapefile e.g., "c:\dmilab\tl_2009_51510_tract00.shp" discussed below 3) Use DMILab Tools>Import-Export-Merge to integrate data from 1) and 2) above. 4) Use DMILab GIS (or your preferred GIS software) to create a thematic map (generated as 3). Repeatedly use steps 1-4 to meet wide-ranging needs. The DMILab start-up view provides access to mapping and GIS (Geographic Information System) operations. Use the main menu to access features including the GeoGateway and Import-Export-Merge operations. DMILab GIS ... mapping and geospatial/pattern analysis [top] The DMILab start-up view (see above) provides access to the GIS control legend (left panel) and map view window (right panel). Open and save projects using the main menu File operations. Manage the map view panel through use of layers shown in the control legend panel and associated layer editor. Navigate geography in the map view window through use of buttons/features available on the toolbar including zoom, pan/drag, identify/select and query. About the Start-up GIS Project. The start-up GIS project is focused on Alexandria, Virginia. This GIS project is comprised of four shapefiles. The GIS project was developed from scratch using DMILab tools. The four shapefiles were downloaded/created using the GeoGateway operations (see below). You can create a similar GIS project for your areas of interest anywhere in the U.S. Join us in a Webinar to see specific steps and discuss your geography. Develop your own GIS project. Analyze economic prosperity by Congressional District ... the following view shows patterns of 2008 median household income by congressional district [more about this project] 
The DMILab GIS operations make use of components developed for the CommunityViewer (CV) GIS software. For more information about the DMILab GIS operations see the CommunityViewer GIS User Guide. GeoGateway ... Access to Extensive Shapefiles & MapCompiler [top] GeoGateway provides GUI access/downloading of Census Bureau TIGER, among other. shapefiles for immediate use with GIS software. GeoGateway was developed as feature in the CommunityViewer (CV) GIS software. Start GeoGateway via the DMILab menu operation File>GeoGateway. 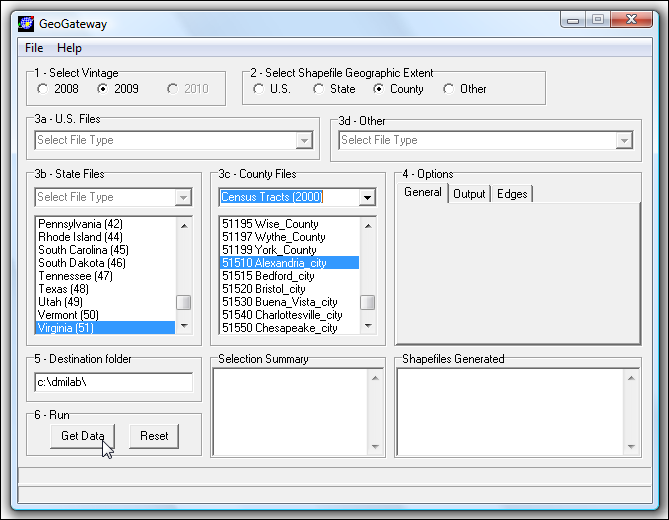 The above settings illustrate the selections to access/download the Alexandria, VA by census tract boundary shapefile. The shapefile is saved as c:\dmilab\tl_2009_51510_tract00.shp and can be immediately opened in the DMILab GIS operations. Download other related shapefiles (e.g., roads) and knit together a custom GIS project; hence the reference to mapcompiler. The dbase file associated with this shapefile (c:\dmilab\tl_2009_51510_tract00.dbf) is used in the default/start-up view of the DMILab Import-Export-Merge operation (see below). GeoGateway operations are described in more detail in the CommunityViewer GIS User Guide. Import-Export-Merge [top] The Import-Export-Merge has been developed to provide a solution to needs including integration of: 1) Census Bureau subject matter data (mainly FactFinder) with Census Bureau TIGER shapefiles ... this is not easy, is error prone and time consuming. 2) specific data fields from multi-sourced statistical data programs for specific geography; e.g., Census 2000 attributes and American Community Survey attributes for all counties in a state. 3) a broad array of secondary statistical data with Proximity Situation & Outlook datasets. Feature/operation summary: • Start Import-Export-Merge via the main menu Tools. The start-up view described below appears. • Import an XLS file into a grid (left grid panel). -- features are included specifically designed to handle FactFinder downloaded files. • Create a structure for a dBase structured file for this XLS file. • Export the XLS grid data to a new dBase structured file (DB1 -- middle grid panel). • Select fields of the new dBase file (DB1) to be merged with fields from another dbase file (DB2). -- typically selected fields of the FactFinder statistical data downloaded file. • Select fields of a second dbase file (DB2) to be merged with DB1 fields. -- typically the dbase file associated with a shapefile having geography corresponding to DB1. • Use new shapefile to create thematic map; perform pattern analysis with DMILab GIS or other GIS software. Import-Export-Export Start-up -- Importing a FactFinder (or any) Excel File Select the downloaded FactFinder (any XLS) file and click the Open button in the XLS section. In the following view, the imported XLS file appears in the populated grid to the left. To the far left is the list of data fields and names that are to be used to export/save the data in dbase structure (Export button, next step). 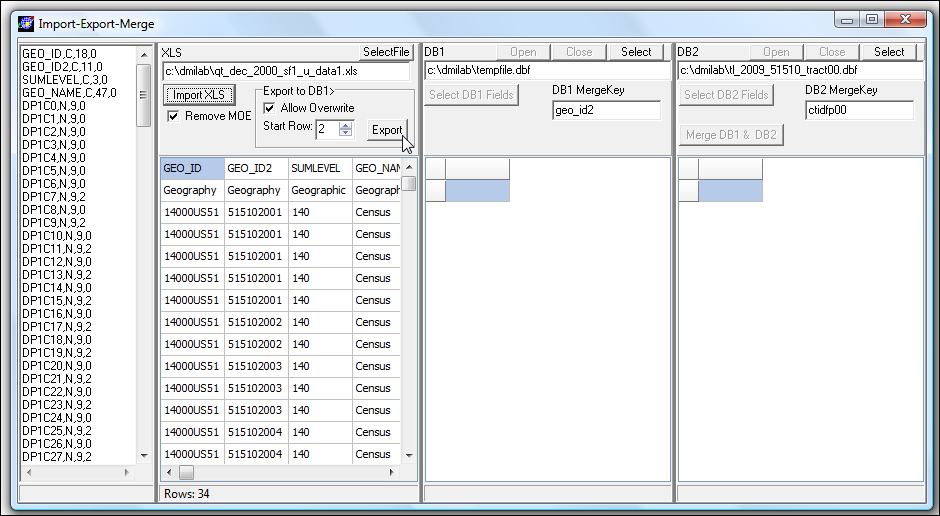 The DMILab installer includes three sample FactFinder XLS files. The start-up view shows one of these files ("c:\dmilab\qt_dec_2000_sf1_u_data1.xls"). This file is the Census 2000 Demographic Profile 1 data by census tract for Alexandria, VA (county equivalent area). Clicking Open (above the XLS grid) imports this file and determines field attributes used to export to/create a dbase structured file. Download your own FactFinder dataset (choose to download as Microsoft Excel). Adapt this to your own geography of interest. Choose any table(s) or profiles. Choose any type of geography (use "geo within geo" FactFinder setting). Exporting the Excel File to dBase 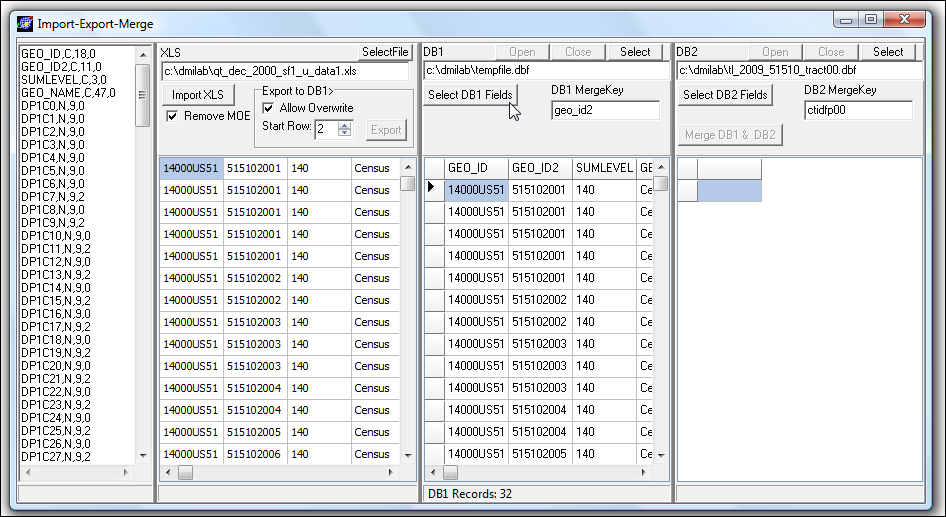
Selecting Fields from FactFinder dBase File (to merge with shapefile dbf/any dbf) 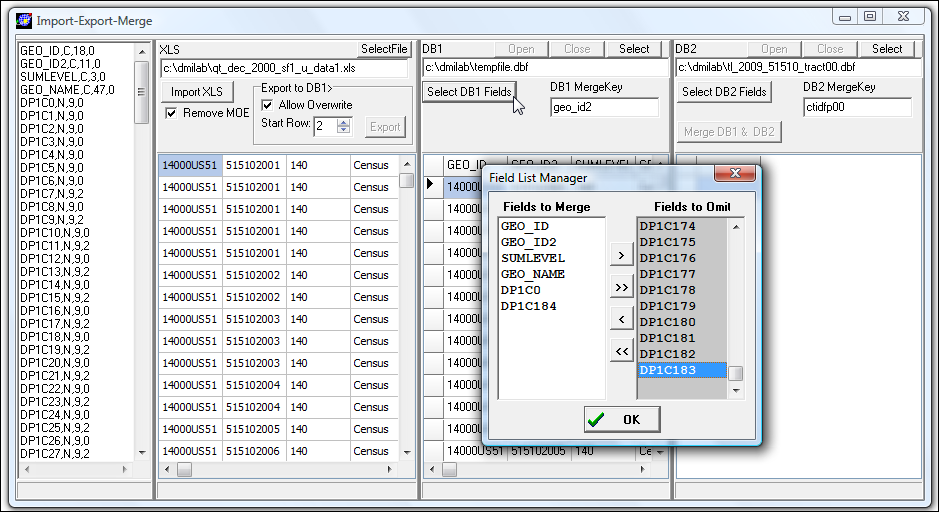
Selecting Fields from Shapefile dBase File (to be included in new merged output file) 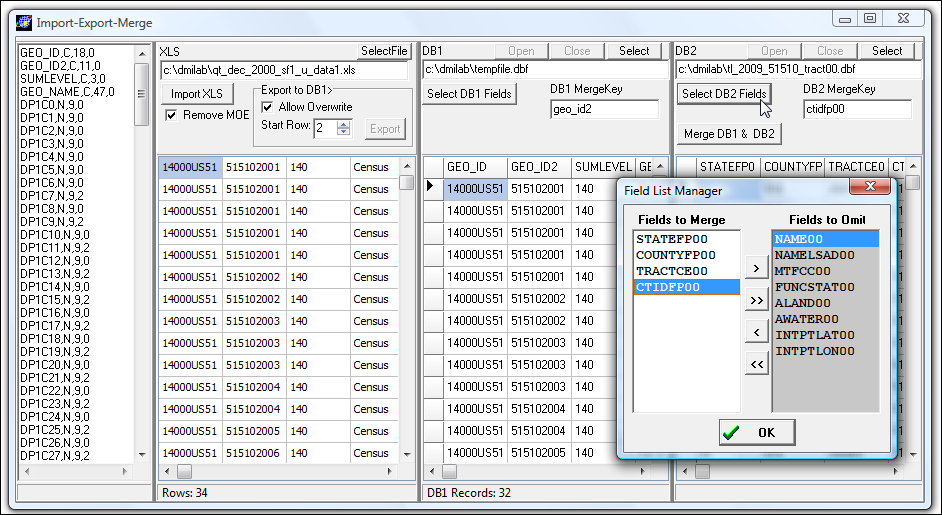
Click Merge Button and New Merged Shapefile DBF is Generated 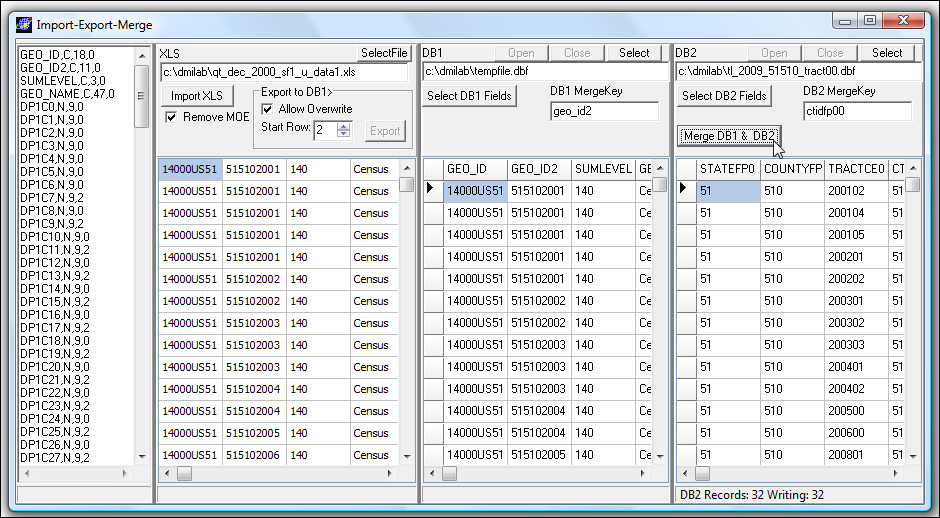
Back to Main/GIS View; View New Data in Shapefile 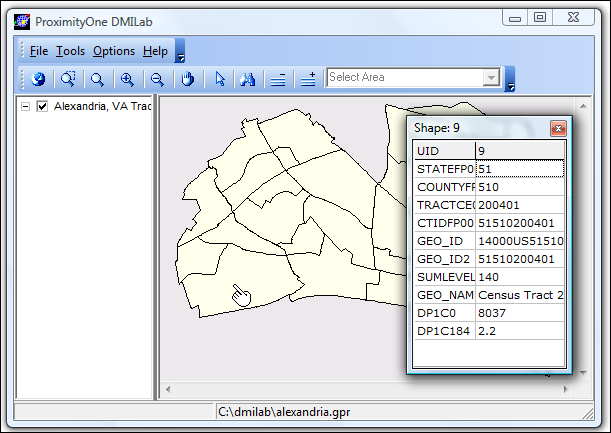
Installation Run the DMILab installer http://proximityone.com/dmilab/dmilab_setup.exe to set up the basic software and data. The installer places these files on your computer in the default folder c:\dmilab (recommended). The start-up view will show the Alexandria, VA project. The U.S. National Project is also included in the setup. To use the national project, with DMILab running, use File>Open and open the project file c:\dmilab\us1.gpr. Terms of Use. DMILab is licensed on a perpetual, personal, end-use basis with no redistribution of the software or data files. There are no warranties. Annual updates and Webinar support sessions are available. Using FactFinder [top] FactFinder is the Census Bureau Web-based data access and delivery system. Among many other statistical programs, FactFinder provides access to data from the decennial census and American Community Survey programs. DMILab tools enable you to knit together data that may be accessed using FactFinder as well as many other data access resources. FactFinder does not enable the user to integrate data from different statistical programs; DMIlab tools may be used to meet this need. For example, use DMILab tools to merge together data from American Community Survey (ACS) estimates with Census 2000 data for all congressional districts or all states. Another example, use DMILab tools to integrate statistical program subject matter data into Census Bureau TIGER shapefiles for GIS and mapping applications. This section is not a general guide to using FactFinder. These notes are intended to help insure that the steps are clear to download a file using FactFinder for use with DMILab. Examples of using DMILab tools to access data from Census 2000 and American Community Survey are reviewed below. Some steps may be omitted or described generally. Census 2000 -- DP1 Demographic Profile. Follow the steps listed below to access/download the Census 2000 DP1 Demographic Profile data by census tract for Alexandria, VA. This file is included with the DMILab setup -- "c:\dmilab\qt_dec_2000_sf1_u_data1.xls". Apply these same steps to geography and subject matter for your applications. Start FactFinder: http://factfinder.census.gov. Select Datasets (at left). Select Decennial Census. Use default Census 2000 Census 2000 Summary File 1 and click Quick Tables at right. Click the upper gray tab "geo within geo". Next choose Tracts. Next choose County. Next choose Virginia. Next choose Alexandria city. Next choose All Tracts. Click Add. Click Next. Click DP-1 Profile of General Demographic Characteristics. (top of list) Click Add. Click Show Result. The data display. Now click "Download" in the Print/Download drop-down. In the pop-up window, you must choose "Microsoft Excel (.xls)" - see graphic.  When the zip file is opened for extract, you need only one file extracted - see graphic. 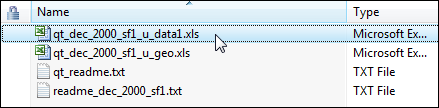 To keep data locations consistent, it is suggested that all files be saved to c:\dmilab. That completes processing for this FactFinder download. There are four types of Demographic Profiles, also referred to as Quick Tables in FactFinder, for Census 2000 and the American Community Survey that contain the most widely used summary data. The download described above is for DP1. Using DMILab tools, you could download each of the DP1 through DP4 from Census 2000 and merge selected items from each of them into a shapefile for thematic mapping; not possible using Census Bureau resources. Census 2000 -- Selected Tables. The main alternative to the DP datasets are groups of selected tables that provide more detail than available from the DPs. Follow the steps listed below to access/download the Census 2000 selected tables data by census tract for Alexandria, VA. This file is included with the DMILab setup -- "c:\dmilab\dt_dec_2000_sf3_u_data1.xls". Apply these same steps to geography and subject matter for your applications. Start FactFinder: http://factfinder.census.gov. Select Datasets (at left). Select Decennial Census. Select Census 2000 Summary File 3 (SF 3) - Sample Data. Click Detailed Tables at right. Click the upper gray tab "geo within geo". Next choose Tracts. Next choose County. Next choose Virginia. Next choose Alexandria city. Next choose All Tracts. Click Add. Click Next. Click P8. Click Add. Click P53. Click Add. Click Show Result. The data display. Now click "Download" in the Print/Download drop-down. In the popup window, you must choose "Microsoft Excel (.xls)" - see graphic. When the zip file is opened for extract, you need only one file extracted - see graphic. 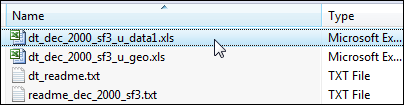 To keep data locations consistent, it is suggested that all files be saved to c:\dmilab. That completes processing for this FactFinder download. Pattern Analysis: Examining Economic Prosperity by Congressional District [top] This section shows how to acquire required data, integrate median household income (American Community Survey Table B19013) into the national scope congressional district boundary shapefile and create a thematic map using a DMILab GIS project using that shapefile. Follow this set of steps to develop a similar application/project using other subject matter and/or geography. Make your own flexible, extendable GIS project and create maps/analytical depictions like the one shown below -- 2008 median household income by 111th Congressional District.
Join us in a Web session to learn more; develop your own GIS projects. STEP 1 -- Get the 2008 ACS subject matter data using FactFinder Start FactFinder: http://factfinder.census.gov. Select Datasets (at left). Select American Community Survey. Select 2008 American Community Survey 1-Year Estimates Click Detailed Tables at right. Click the upper gray tab "geo within geo". Next choose Congressional Districts. Leave "Within" as Nation. Next choose All Congressional Districts. Click Add. Click Next. Next Click Table B19013 Median Household Income. Click Add. Click Show Result. The data display. Now click "Download" in the Print/Download dropdown. In the popup window, you must choose "Microsoft Excel (.xls)" - see graphic. When the zip file is opened for extract, you need only one file extracted - see graphic. 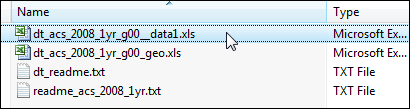 To keep data locations consistent, it is suggested that all files be saved to c:\dmilab. That completes processing for this FactFinder download. The ACS downloaded file should now show on your computer as c:\dmilab\dt_acs_2008_1yr_g00__data1.xls. We are done with FactFinder; that Web browser session can be ended. STEP 2 -- Get the required shapefiles. With DMILab running use File>GeoGateway to open the GeoGateway form. In Group 2, click U.S. In Group 3a, click States (2000) smoothed. Click GetData. The shapefile "c:\dmilab\st99_d00.shp" shows as on your computer. In Group 2, click U.S. In Group 3a, click Congressional Districts (110th) smoothed. Click GetData. The shapefile "c:\dmilab\cd99_110.shp" shows as on your computer. Close the GeoGateway form. STEP 3 - Merge the FactFinder data into the CD shapefile DBF. On DMILab main menu, click File>Close Project. On DMILab main menu, click Tools>Import-Export-Merge. In the XLS section, click Select and choose c:\dmilab\dt_acs_2008_1yr_g00__data1.xls. In the XLS section, click Select Open; the file is opened in the XLS section grid. In the DB1 section, click Export; the DB1 section grid populates. Click Select DB1 Fields; the Field List Manager form opens. We use all fields; Click OK. In the DB2 section, click Select and choose C:\dmilab\cd99_110.dbf. Click Select DB2 Fields; the Field List Manager form opens. Click >> button; all fields move to right. Click STATE and then click < ... STATE moves to left. Click CD and then click < ... CD moves to left. Click OK to close form. In the DB2 MergeKey, type in STATE+CD. ALL SETTINGS ARE COMPLETE; Click Merge DB1 & DB2. The Merge Complete message appears; the data merge into the shapefile is complete. See the median household income as the rightmost field in the DB2 grid. Close the Import-Export-Merge form. STEP 4 -- Set up the GIS Project. On DMILab main menu, click File>Close Project. Click + button on toolbar. Select C:\dmilab\cd99_110.shp. Click + button on toolbar. Select C:\dmilab\st99_d00.shp. Click File>Save Project As and save c:\dmilab\cd_mhi1.gpr. Use zoom tool on toolbar to position 48 contiguous states in map window. Click File>Save Project, The basic project is now developed. Proceed to create legend settings with layer editor to create a thematic map similar graphic shown below.
Additional Information Proximity develops geodemographic-economic data and analytical tools and helps organizations knit together and use diverse data in a decision-making and analytical framework. We develop custom demographic/economic estimates and projections, develop geographic and geocoded address files, and assist with impact and geospatial analyses. Wide-ranging organizations use our tools (software, data, methodologies) to analyze their own data integrated with other data. Contact Proximity (888-364-7656) with questions about data covered in this section or to discuss custom estimates, projections or analyses for your areas of interest. |
|
|