
|
|
|
Census 2010 data provide a way to examine ZIP Code demographics by school district. Many ZIP codes transcend school district boundaries; ZIP codes may exist in more than one school district. Use data described in this section to view/analyze characteristics of ZIP code areas that intersect with school districts of interest. See which school districts are served by a specific ZIP code and associated demographics. Sort the interactive table below on population in descending order to see that the School District/ZIP code areas with the largest population include Chicago/60629 (113,916), New York City Schools/11368 (109,931) and Los Angeles Unified/90011 (103,892). Visually Relating ZIP Codes and School Districts The following view shows the Dallas, TX metro focused on Collin and Denton counties. The map shows patterns of Census 2010 rental vacancy rate by ZIP Code with ZIP code labels. School district boundaries are shown with bold brown boundaries and district names as labels. The pointer/hand is shown in ZIP code 75024 -- mostly in Plano city.  - view developed with CV XE GIS and related GIS project. - See more detail about this view below. Developing the Data Census 2010 ZIP Code Tabulation Areas (ZCTAs) and school districts are both comprised of sets of census blocks. Census block level data from the Census 2010 Summary File 1 (SF1) have been aggregated into ZIP code-School District parts to develop data presented in the ranking table. Data in the ranking table are part of the ProximityOne national ZIP Code-School District dataset. See additional details. Use the ranking table to view a school district by ZIP code and selected associated demographics for each ZIP code portion in that school district. Examine how ZIP codes are split by specific school districts. Only those ZIP code-school district combinations with population of 10 or more are included. See related ranking table with total ZIP code population (ZIP code not split) at http://proximityone.com/cen2010_zcta_dp.htm. ZIP Code Demographics by School District - Interactive Table See usage notes below table. See related tables -- http://proximityone.com/rankingtables.htm. All data based on Census 2010 Summary File 1. See column header descriptions below table. Click ShowAll button between Find/Queries. Using the Ranking Table • Click on a column header to sort on that column; click column header again to sort in other direction. • Click ShowAll button to show all tabulation areas and restore full set of data view. • Click State to select on geographies in a selected state (click ShowAll between selections). • Click SumLev to select a type of geography (click ShowAll between selections). • Name Query -- key in school district name (case sensitive) in text box to right of Find-in-Name button. - Next, click Find-in-Name button to locate all matches. - case sensitive; click ShowAll button between queries. • ZIP Code Query -- key in ZIP code in text box to right of Find-in-ZIP button then click button to locate all matches. - ZIP code must be FIPS 5 digit code, lead zero as applicable); click ShowAll button between queries. See further application/use examples below map section further down on this page. Column Headers • Name -- School District Name • StAb -- State Postal Abbreviation • Type -- School District Type (Elementary, Secondary, Unified) • DistCode -- School District Federal Code • ZIP -- Census 2010-based ZIP Code Tabulation Area Census 2010 SF1-sourced population aggregated from census blocks: • Population • Housing • %White A - Percent Population White alone (P0030002) • %Black A - Percent Population Black or African American alone (P0030003) • %AI/AN A - Percent Population American Indian and Alaska Native alone (P0030004) • %Asian A - Percent Population Asian alone (P0030005) • %NHOPI A - Percent Population Native Hawaiian and Other Pacific Islander alone (P0030006) • %OthRace A - Percent Population Some Other Race alone (P0030007) • %2+Races - Percent Population Two or More Races (P0030008) • %Hispanic - Percent Population Hispanic or Latino (P0040003) -- percents are percentages of total population in this ZCTA Mapping ZIP Code-School District Areas The following view, developed using the CV XE GIS, shows the Dallas, TX metro focused on Collin and Denton counties. The map shows patterns of Census 2010 rental vacancy rate by ZIP Code (see in legend at left) with ZIP code labels. School district boundaries are shown with bold brown boundaries and district names as labels. The pointer/hand is shown in ZIP code 75024 -- mostly in Plano city. Using the ranking table above, it is possible to view demographics for the parts of the ZIP code area within three school districts: Plano ISD, Lewisville ISD and Frisco ISD. See the next graphic. 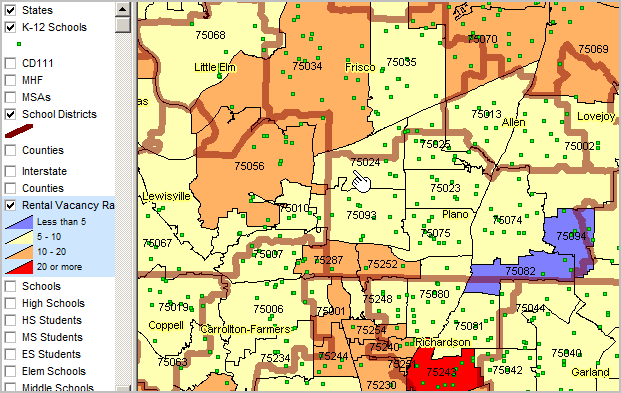
The following static view of the ranking table above is focused on the same ZIP/area. To develop this view, click ShowAll, Find ZIP with 75024 in the edit box. The total Census 2010 population for ZIP 75024 is 36,039 (11631+2091+22317). The same method of examining city/place by ZIP code area part can be applied to any area of the U.S. 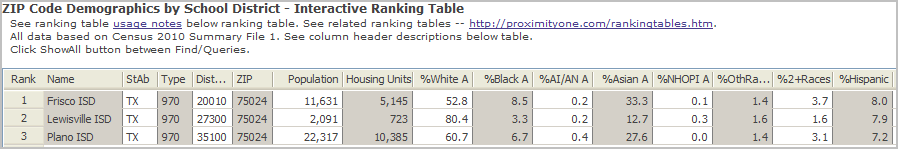
Find which school district(s) include a ZIP Code of interest. -- Click ShowAll. Click Find ZIP with 75024 (use your ZIP of interest) in the edit box. ... this locates/shows school district(s) that intersect with this ZIP. What are the demographic characteristics of each ZIP Code part intersecting with a school district? -- Click ShowAll. Click Find in Name with Plano (use your case sensitive district name of interest) in the edit box. ... this locates/shows all ZIPs partly/wholly in the selected district. ... How do ZIP codes rank by demographic characteristic within a specific district? -- From the view of Plano (use your district) intersecting ZIPs, ... click a column header to sort on a column/subject of interest. ... the view refreshes; click same header again for other direction; choose another item and repeat. Extending the Scope of Subject Matter Detail As described above, the method used to develop the ZIP Code-School District data shown in the table was to aggregate census block demographics. While only a few attributes are shown in the table, a much wider range of data could be provided in a dataset -- any of the census block level data from Census 2010 Summary File 1 (SF1). A list of subject matter items is provided by link on that page. A key subset of the SF1 items are those items included in the block level 'demographic profile.' See a list of those items at http://proximityone.com/cen2010_dpsf_items.htm. Other priority items for education-related analyses would be the population by single year of age for the population under 20 years. There are no 'richer demographics' from Census 2010 owing to the reduced scope of questionnaire. However, starting with the American Community Survey (ACS) 2010 5-year estimates, ZIP Code tabulation area demographics are available. While there are no block-level data from ACS, thus not possible to use ACS data to show parts of ZIP Code areas by school district, a wider selection of richer demographics is available for the entire ZIP Code social characteristics, economic characteristics, housing characteristics). Extended Geographic Views & Geography The following zoom-in view focuses on ZIP Code 75024 (blue bold boundary) used in the above examples. This view shows detailed roads. Additional layers could be added including geocoded students, tax parcels and census block enhancing analytical possibilities. Other aspects of the view are similar to those described above. The pointer is located in that portion of ZIP 75024 within Plano ISD. 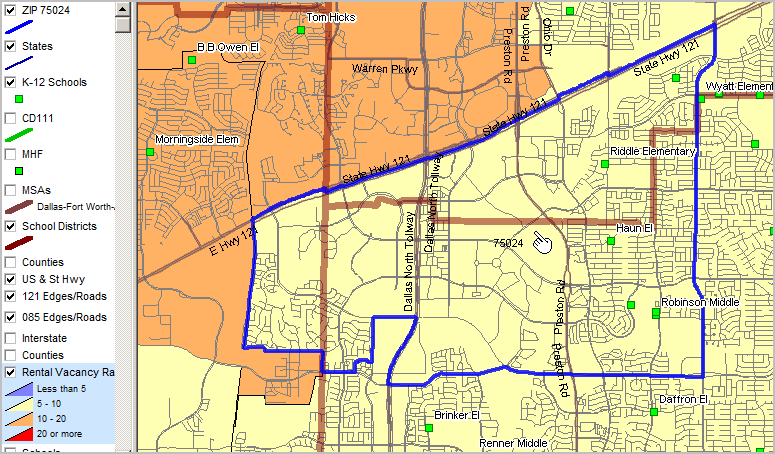
ZIP Code Tabulation Areas Data presented in the ranking table sum to the total population/housing units for the corresponding state. The demographic characteristics for each census block in each state are aggregated into a ZIP-School District combination. There are many instances of ZIP-Place combinations that show zero or nearly zero population. These areas are often geographic slivers, almost lines. While school district boundaries mostly cover the U.S. wall-to-wall, Census 2010 ZIP Code Tabulation Areas are comprised of populated census blocks and do not cover the the U.S. wall-to-wall from a geographic perspective. See more information. ZIP Code Equivalence Files The following 2010 ZIP Code (ZCTA) equivalence/relationship files are available. Contact us for details (888-364-7656). • ZIP to County • ZIP to County Subdivision • ZIP to Place • ZIP to Census Tract • ZIP to Congressional District • ZIP to Metropolitan and Micropolitan Statistical Areas Support Using these Resources Participate in weekly Data Analytics Lab sessions to learn about accessing and using these and related data. Topics covered include: - questions that you have. - navigation through use of program resources. - using your data with these resources. - developing and using projections with these resources. There is no fee for these one-hour Web sessions. Each informal session is structured around selected topics. The open structure provides for Q&A and discussion of application issues of interest. Additional Information ProximityOne develops geodemographic-economic data and analytical tools and helps individuals and organizations knit together and use diverse data in a decision-making and analytical framework. We develop custom demographic/economic estimates and projections, develop geographic and geocoded address files, and assist with impact and geospatial analyses. Wide-ranging organizations use our tools (software, data, methodologies) to analyze their own data integrated with other data. Follow ProximityOne on Twitter at www.twitter.com/proximityone. Contact us (888-364-7656) with questions about data covered in this section or to discuss custom estimates, projections or analyses for your areas of interest. |
|
|