

|
|
Using Census Block Geodemographics: Census 2010 & 2016 Updates -- accessing, comparing and using census block geography and data
August 2016 .. new resources for updated geographic reference and statistical mapping and geography for census block demographic analysis. See the 2016 digital map database main page for general information and related geography. Patterns of Population by Census Block This view illustrates use of 2016 census block shapefile to develop a thematic pattern map of the McKinney/Collin County, TX area showing total population by census block. Use resources described in this section to develop similar maps for any part of the U.S. 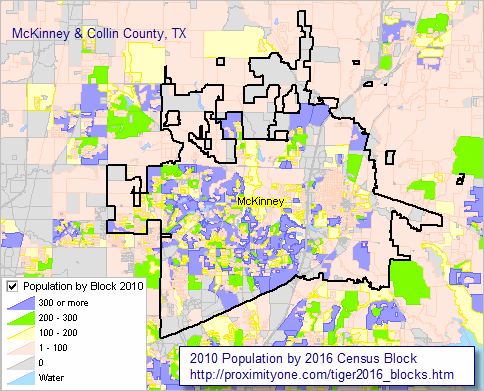 The 2016 digital map database includes many types of files and data. The data are developed in the form of shapefiles and dbase files that may be used directly with the ProximityOne CV XE GIS software at no fee. Perform wide-ranging mapping and geospatial analysis applications using these GIS resources. See more about mapping statistical data. Census Block Data This section is focused mainly on accessing and using 2016 census block shapefiles. Census block shapefiles are organized as state-to-state files. Census blocks cover the U.S. wall-to-wall. In general, census blocks have boundaries as defined by the related TIGER/Line roads shapefiles. Use the U.S. by state interactive table below to examine attributes of TIGER 2010 & 2016 census block characteristics. ProximityOne developed this table by processing each state census block shapefile. See about using the edges shapefile with the CV XE GIS software below in this section. Accessing Census Block Shapefiles & Demographic Data The Census Bureau does not make available census block shapefiles with integrated demographics nor 2016 vintage census block demographic data files. See information below on acquiring these data from ProximityOne. Comparing 2010 and 2016 Vintage Census Blocks Census blocks are geospatially defined for a decennial census. • The number of census block and geocodes generally remain constant for the 10-year period. • Census blocks are the smallest geographic area for which Census Bureau data are tabulated. • Census block demographics are only tabulated from the decennial census by the Census Bureau. ... there are no post Census 2010 census block demographic updates developed by the Census Bureau. ... the exception to this are special censuses conducted for fee by request of local areas. • Boundaries for many census blocks change through the decade (more on this below). ... there are many reasons that for block boundaries changing. ... the most common reason is due to corresponding street/road boundary updates. • Geocodes for census blocks are generally constant throughout the decade. ... block geocodes can change when a corresponding county is reorganized and the county code is changed. ... block geocodes can change when a corresponding census tract is reorganized and the tract code is changed. ... there are many instances of such code changes, they affect perhaps one percent of all blocks. Illustrative Applications The following sequence of graphics shows an example of census blocks in context of related geography. These applications focus on an area in McKinney/Collin County, TX, part of the Dallas metro. See the related step-by-step summary of how you can create these and similar map views using CV XE GIS below in this section. This sequence of views starts with neighborhood/detail ending with larger regional views. Census Blocks: 2010 & 2016 - Graphic below illustrates 2010 & 2016 blocks with different boundaries can be viewed as separate layers - Blue fill pattern is McKinney city; more below. - 2010 vintage blocks: red boundaries; 2016 boundaries: black boundaries. .. 2010 blocks sits "below" 2016 blocks; red only visible when different from 2016. .. 2016 blocks reflect improvements to roads which were corrected after 2010. 2010 vintage block 480853053234036 yellow highlight - view shows a mini-profile for the 2010 vintage block yellow highlighted (block 480853053234036). 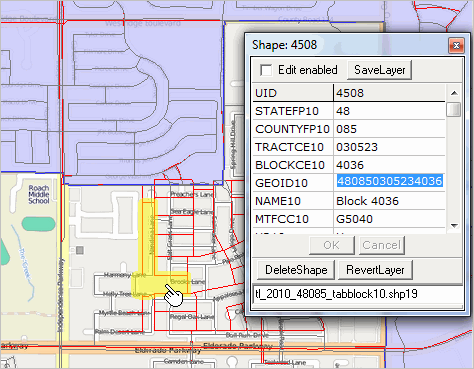 2016 vintage block 480853053234036 yellow highlight - view shows a mini-profile for the 2016 vintage block yellow highlighted (block 480853053234036). - note the block code is the same as for 2010. 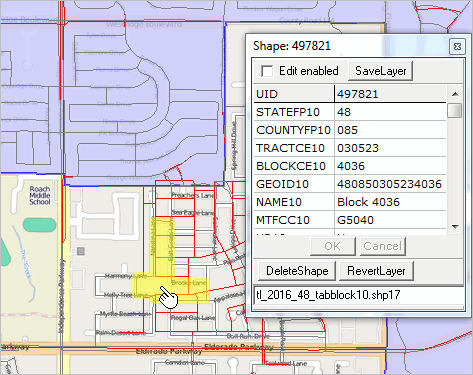 2016 Block 480853053234036 in Isolation 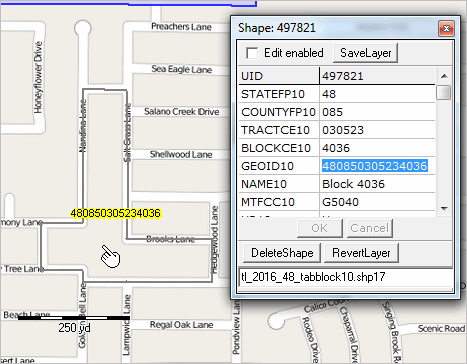 County & City View - A zoom-out shows the McKinney city with blue fill pattern. - broader county view shows extent of how block boundaries differ (where red visible). 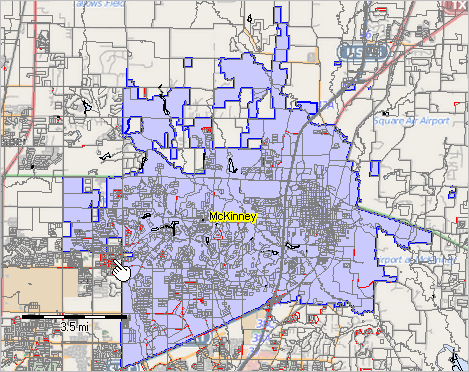 Regional View - A further zoom-out shows the focus area view in context of the metro counties (a related TIGER shapefile) 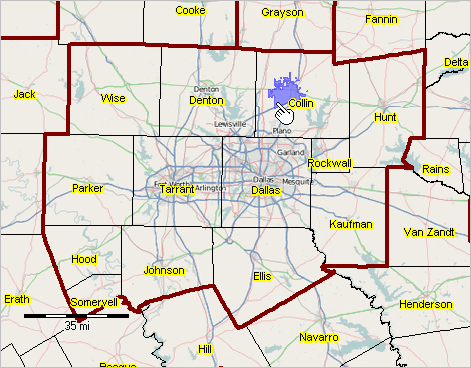 TIGER 2016 Census Blocks TIGER/Line 2016 vintage files were released in August 2016. While many aspects of road coverage remain as described in this section, TIGER/line 2016 includes many updates as well as "new vintage" geography for school districts, state legislative districts, congressional districts and other political/statistical area geography. See more about: • TIGER 2016 Roads. • TIGER 2016 • TIGER/Line in general 2016 Vintage Census Block Files by State -- Interactive Table Click column header to sort; click again to sort other direction. See usage notes below table. See related Related Interactive Tables Column Headers • State • 2016 Shapefile Size in Bytes -- there is one shapefile per state • 2016 Shapefile Size in MB (easier to view) • 2016 Block Count (2010 & 2016 are the same) • 2010 Block Count (2010 & 2016 are the same) • Water Blocks • DVD# • 2016 DBF Size in Bytes - DBF portion of shapefile • 2016 DBF Size in MB (easier to view) The shapefile includes 4 files with extensions ..prj, .dbf, .shp, .shx. Some applications (non-GIS) require only the DBF file (alternatively available as CSV; CSV does not work with shapefile). Using Census Blocks Shapefiles/Data Files with CV XE GIS These operations require a Windows computer with Internet connection 1. Install the ProximityOne CV XE GIS ... run the CV XE GIS installer ... take all defaults during installation 2. Download the TIGER Blocks project fileset ... requires ProximityOne User Group ID (join now) ... unzip TIGER Blocks GIS project files to local folder c:\tiger2016 3. Open the c:\tiger2016\riger2016_blocks.gis project ... after completing the above steps, click File>Open>Dialog ... open the file named c:\tiger2016\tiger2016_blocks.gis 4. Done. The start-up view is shown at top of this section. ProximityOne Census Block Shapefiles & Demographic Data ProximityOne census block shapefiles (or dBase/attributes file only portion) include 100% compatibility with the Census Bureau version with added features and accessibility; nothing is lost, much is gained. ProximityOne version: • includes an extended set of geocodes. .. directly associate city, CBSA, school district, other areas, not directly possible with Census version. • includes integrated demographics, not included in Census version. .. Census version includes no demographics. • available as dBase only for non-GIS applications. .. dBase/attributes file alone (without .shp) not available from Census. .. block attributes file alone also available as CSV (rather than dBase). .. optionally eliminate role of shapefile and dBase file structure altogether. • ready-to-use shapefiles on DVD (or download from our server -- immediate access). .. just put the disc into a drive and directly add road shapefiles to your GIS project. .. no unzipping, no hard disk space usage (optionally copy to hard disk). • includes user application support. Geocodes included are updated/current values for fields included in the original Census 2010 SF! geo header record (pdf; see page 2-8). ProximityOne User Group Join the ProximityOne User Group to keep up-to-date with new developments relating to metros and component geography decision-making information resources. Receive updates and access to tools and resources available only to members. Use this form to join the User Group. Support Using these Resources Learn more about accessing and using demographic-economic data and related analytical tools. Join us in a Data Analytics Lab session. There is no fee for these one-hour Web sessions. Each informal session is focused on a specific topic. The open structure also provides for Q&A and discussion of application issues of interest to participants. Additional Information ProximityOne develops geodemographic-economic data and analytical tools and helps organizations knit together and use diverse data in a decision-making and analytical framework. We develop custom demographic/economic estimates and projections, develop geographic and geocoded address files, and assist with impact and geospatial analyses. Wide-ranging organizations use our tools (software, data, methodologies) to analyze their own data integrated with other data. Follow ProximityOne on Twitter at www.twitter.com/proximityone. Contact us (888-364-7656) with questions about data covered in this section or to discuss custom estimates, projections or analyses for your areas of interest. |
|
|